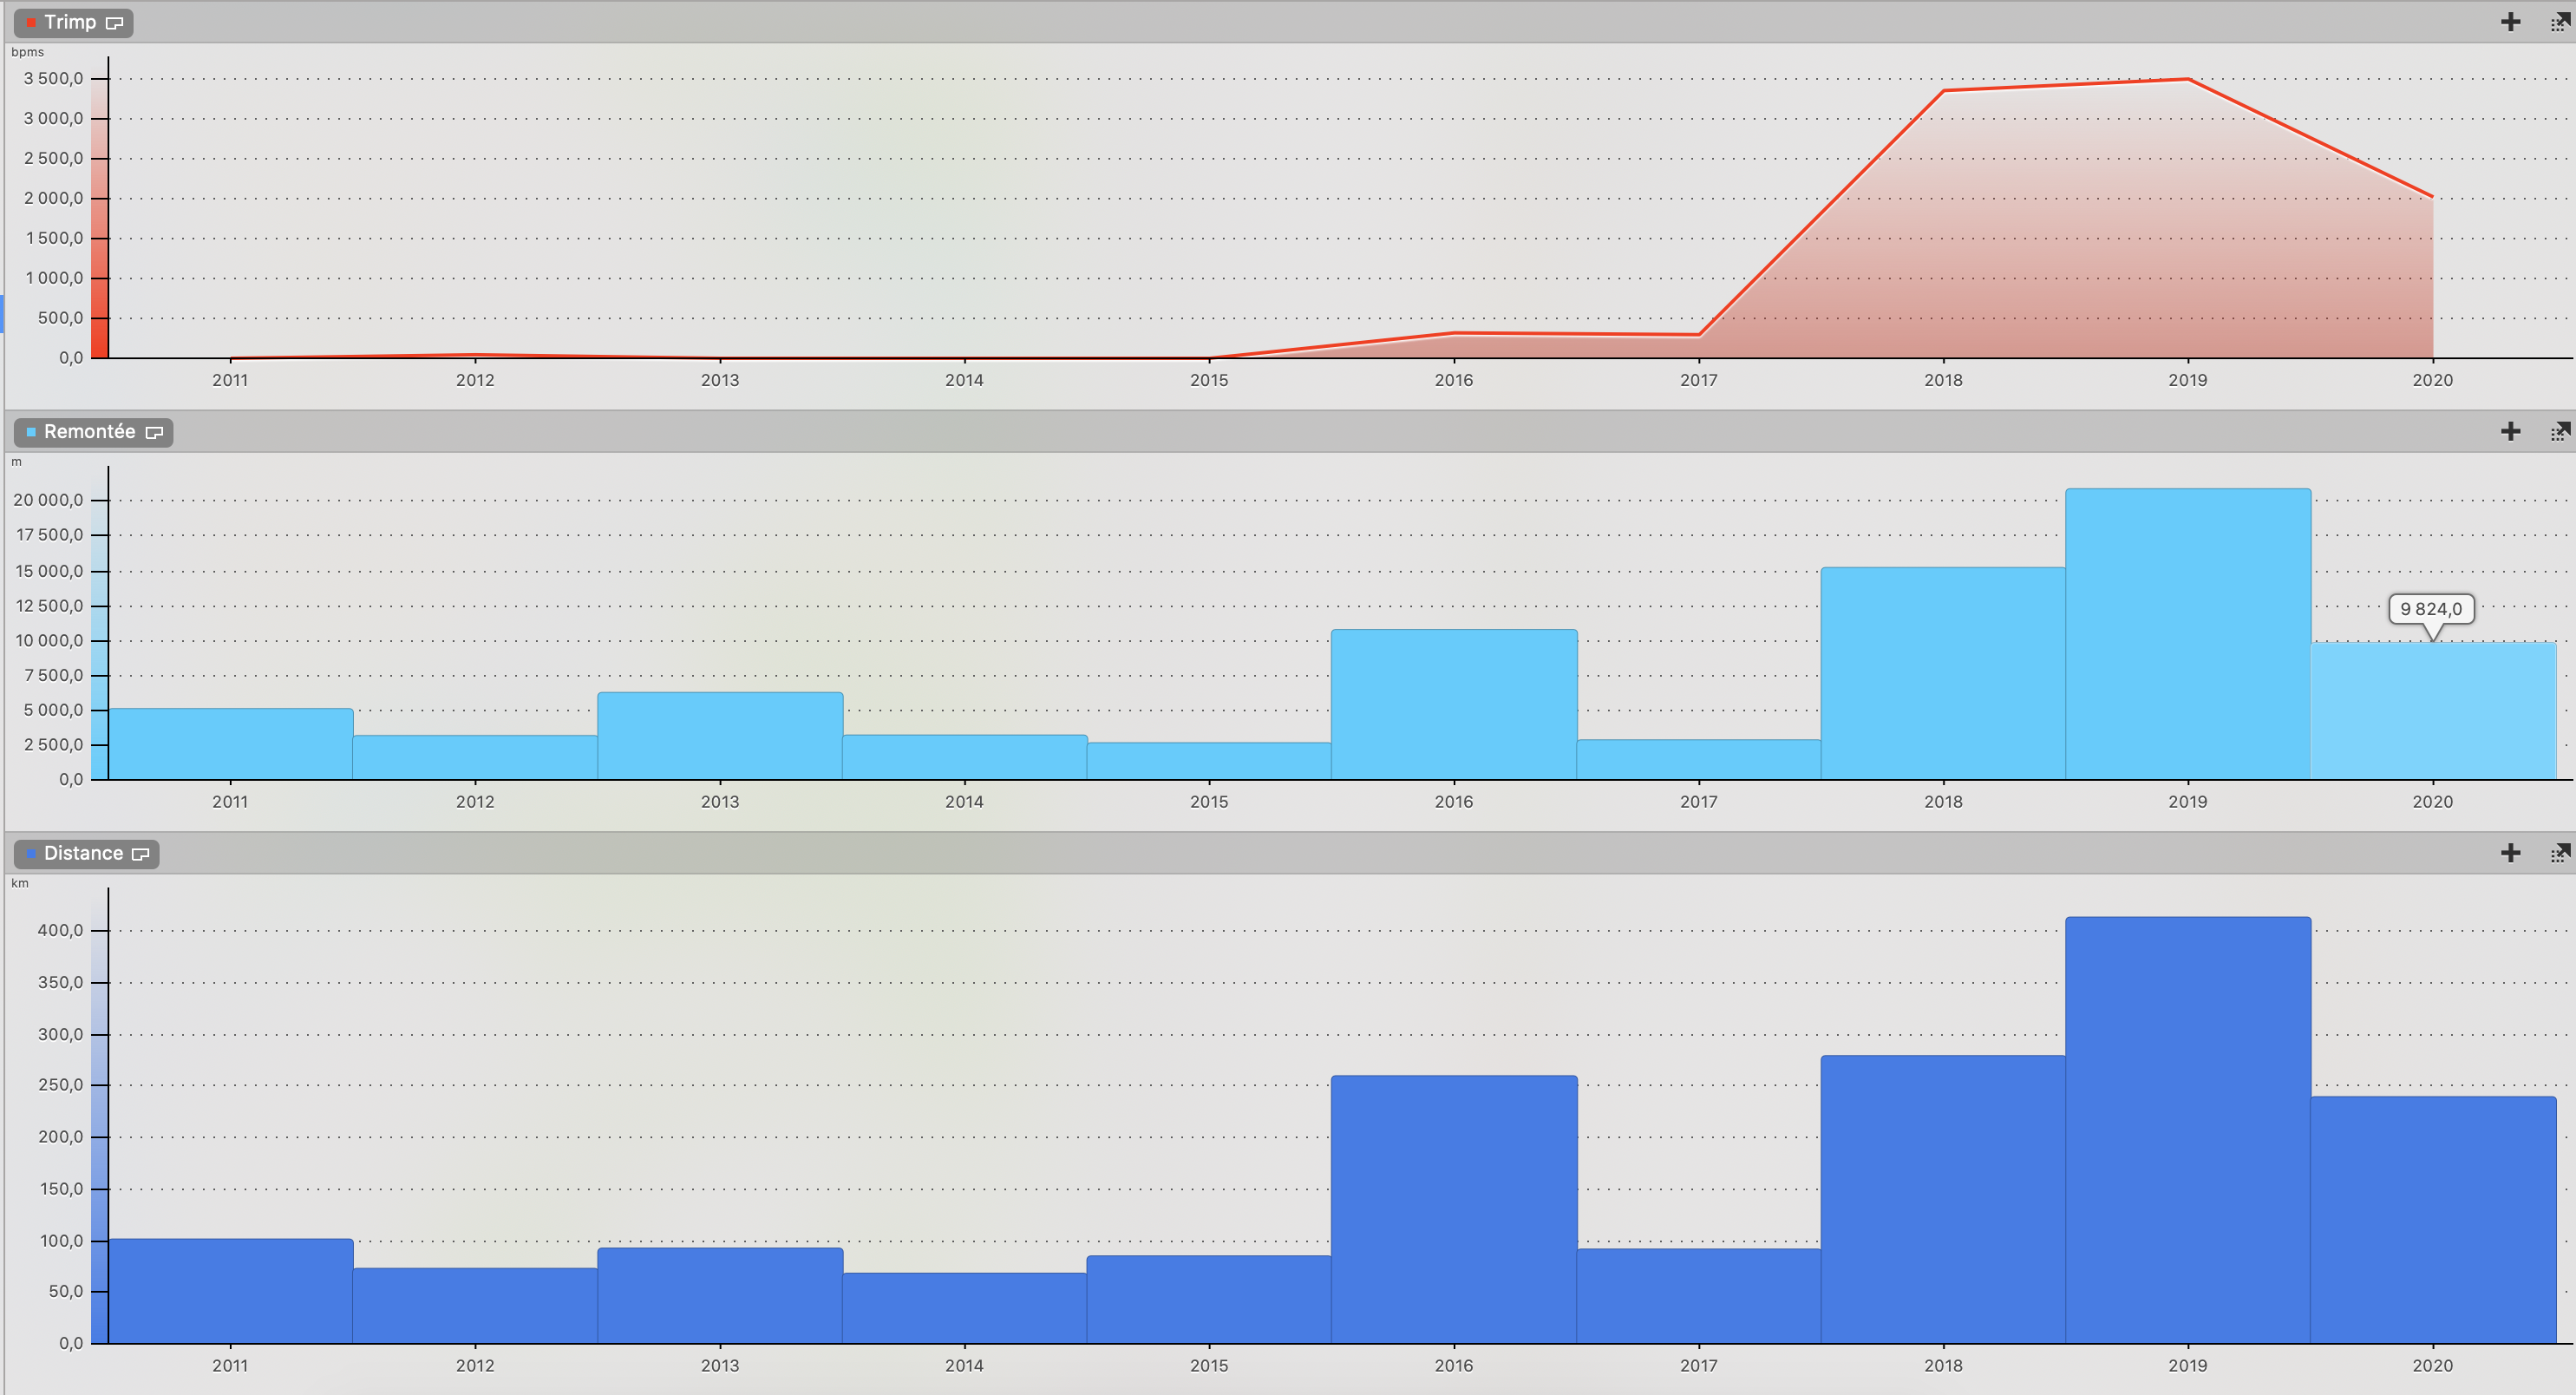
Voici donc les graphiques :
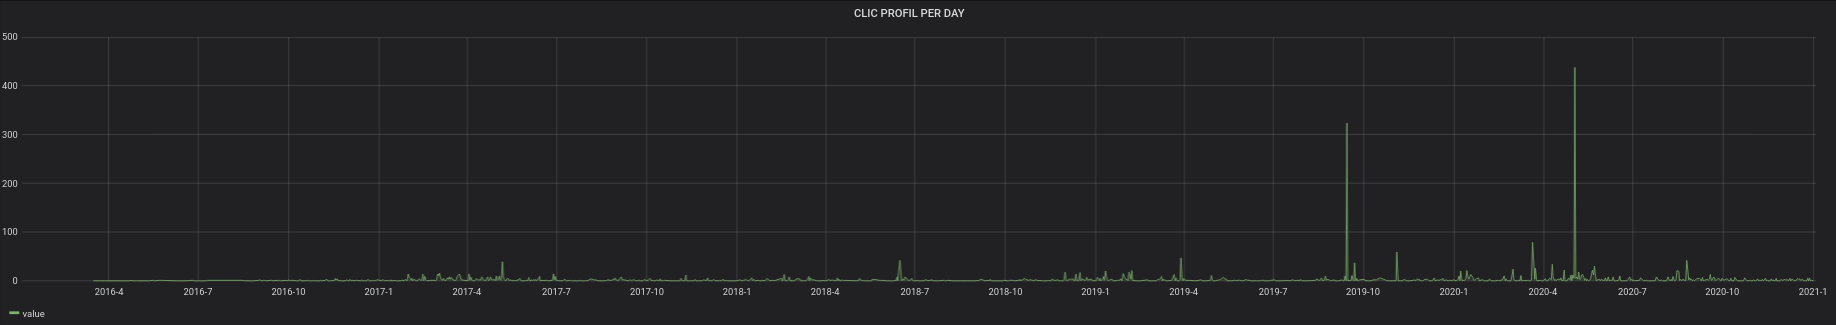
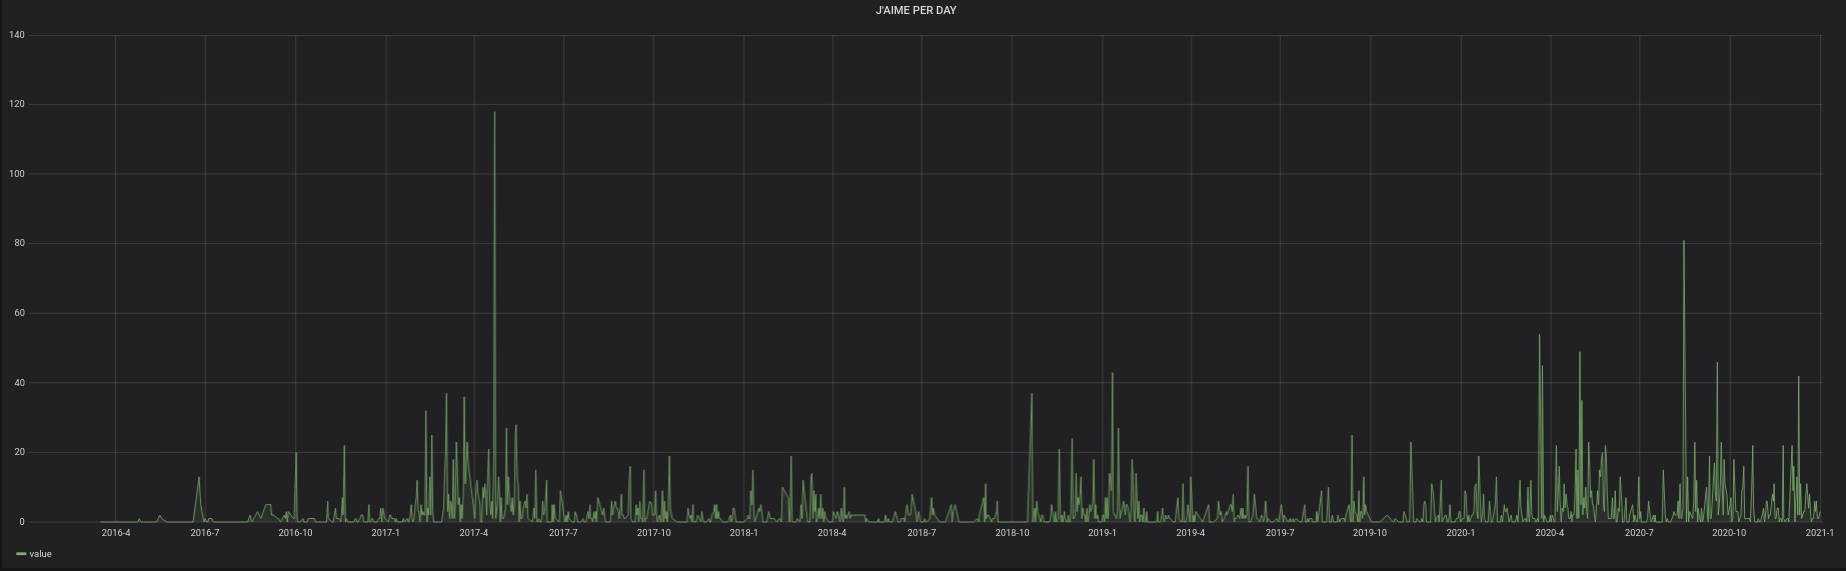
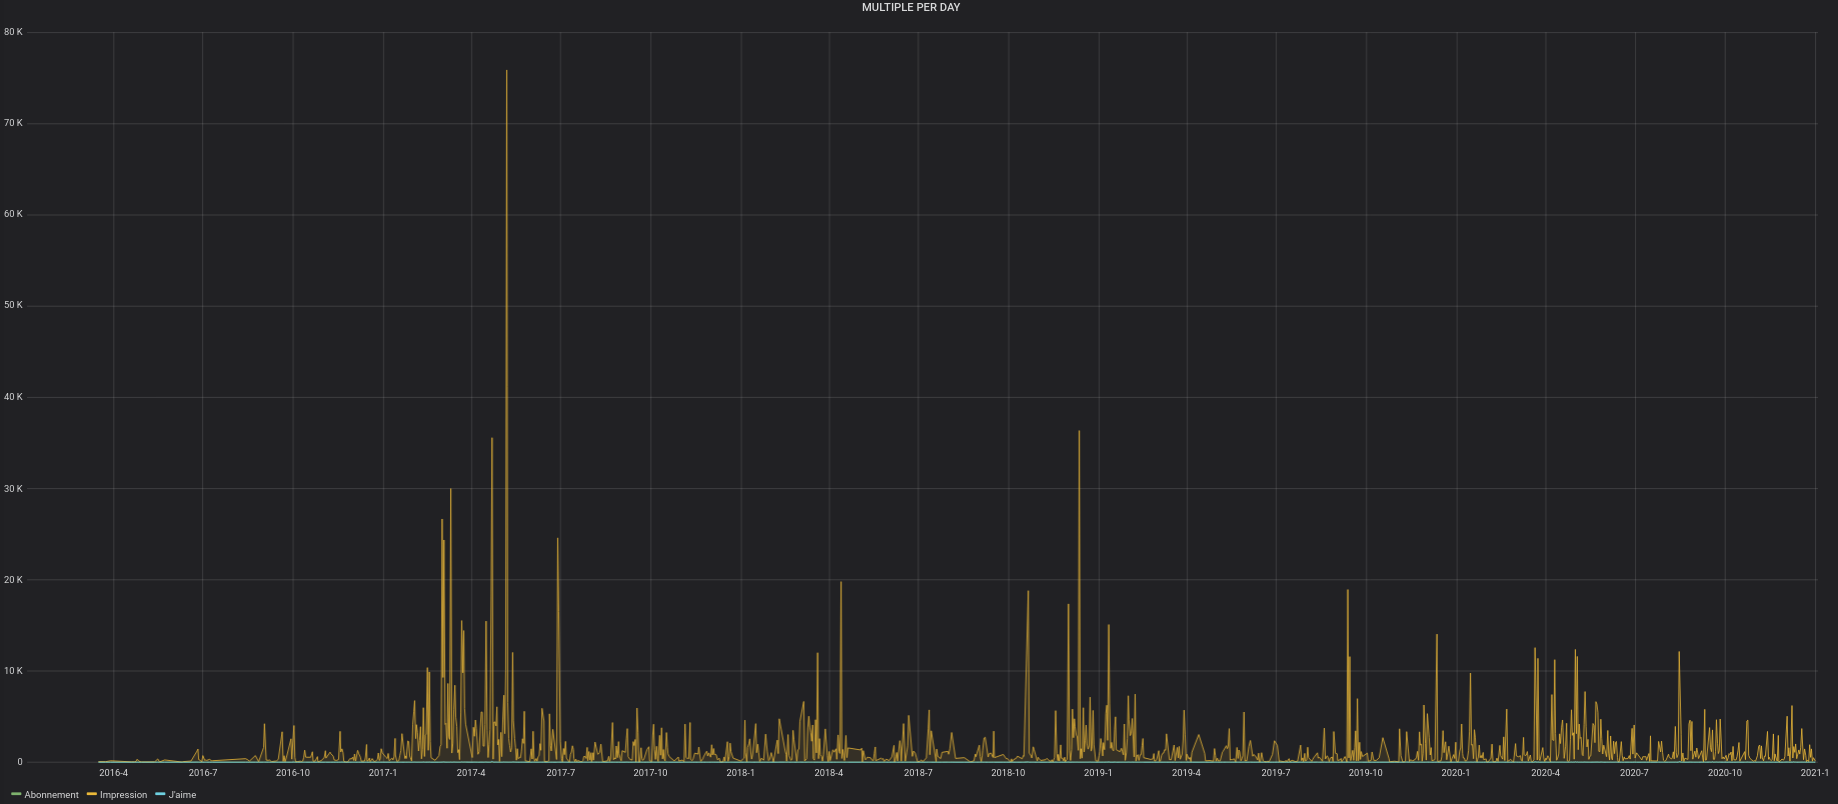

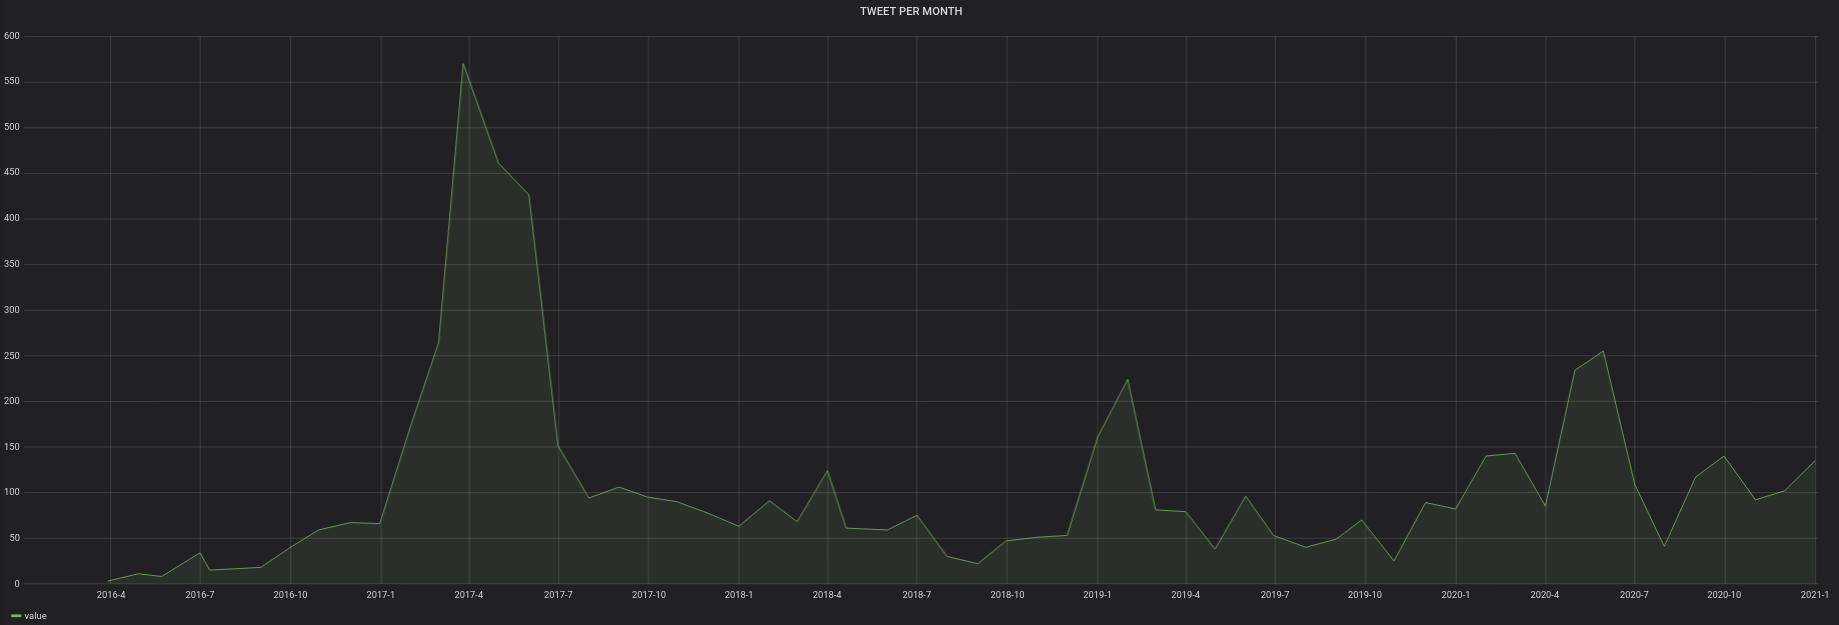
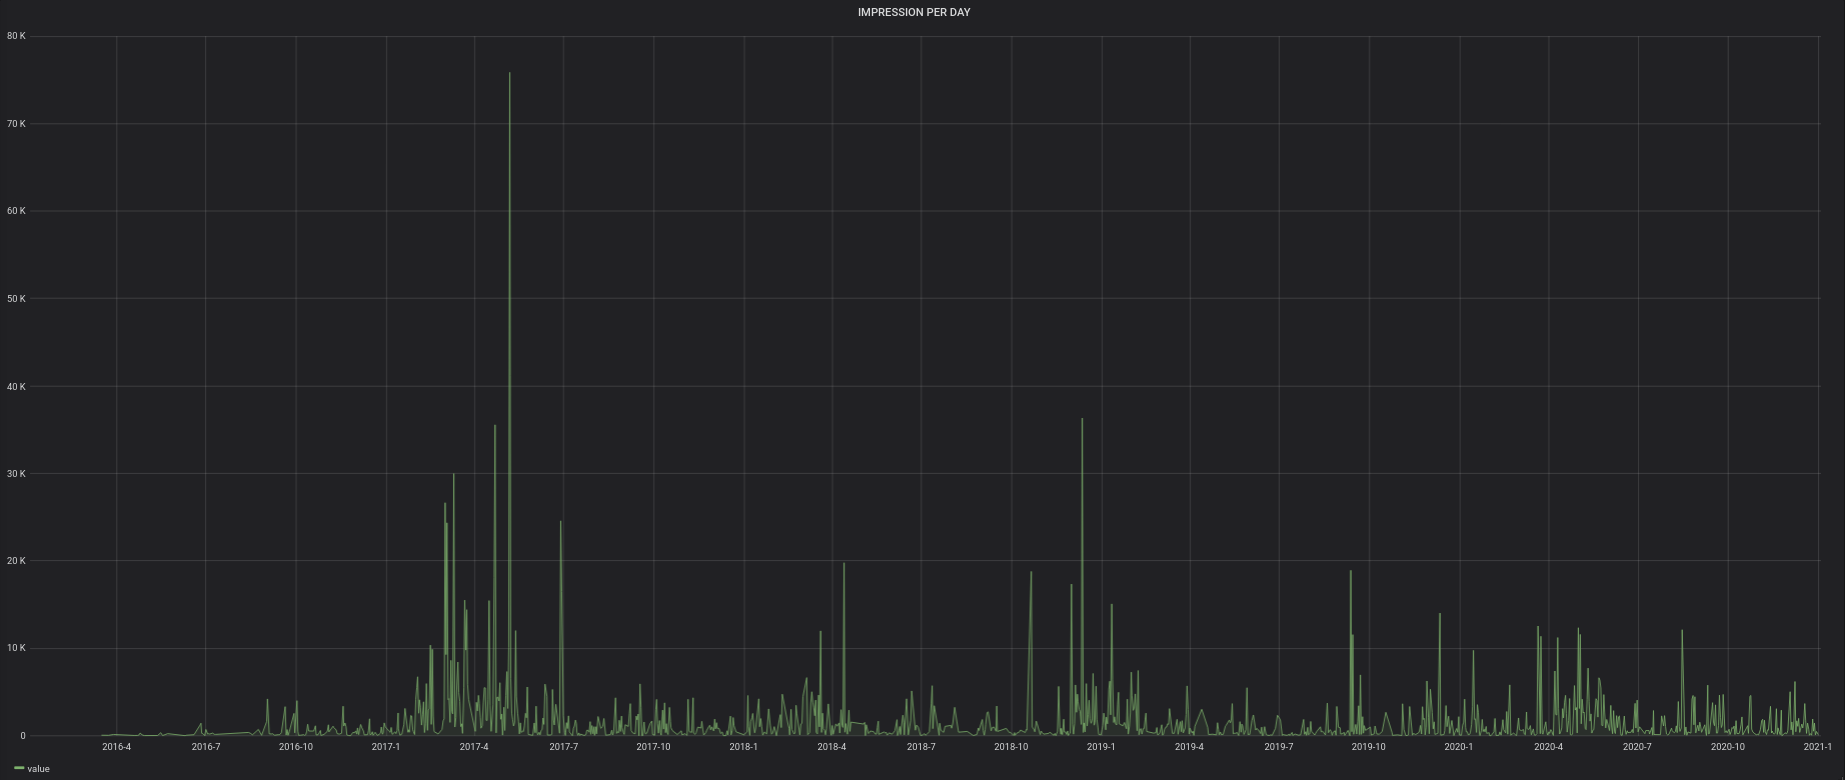
Le programme est en Python.

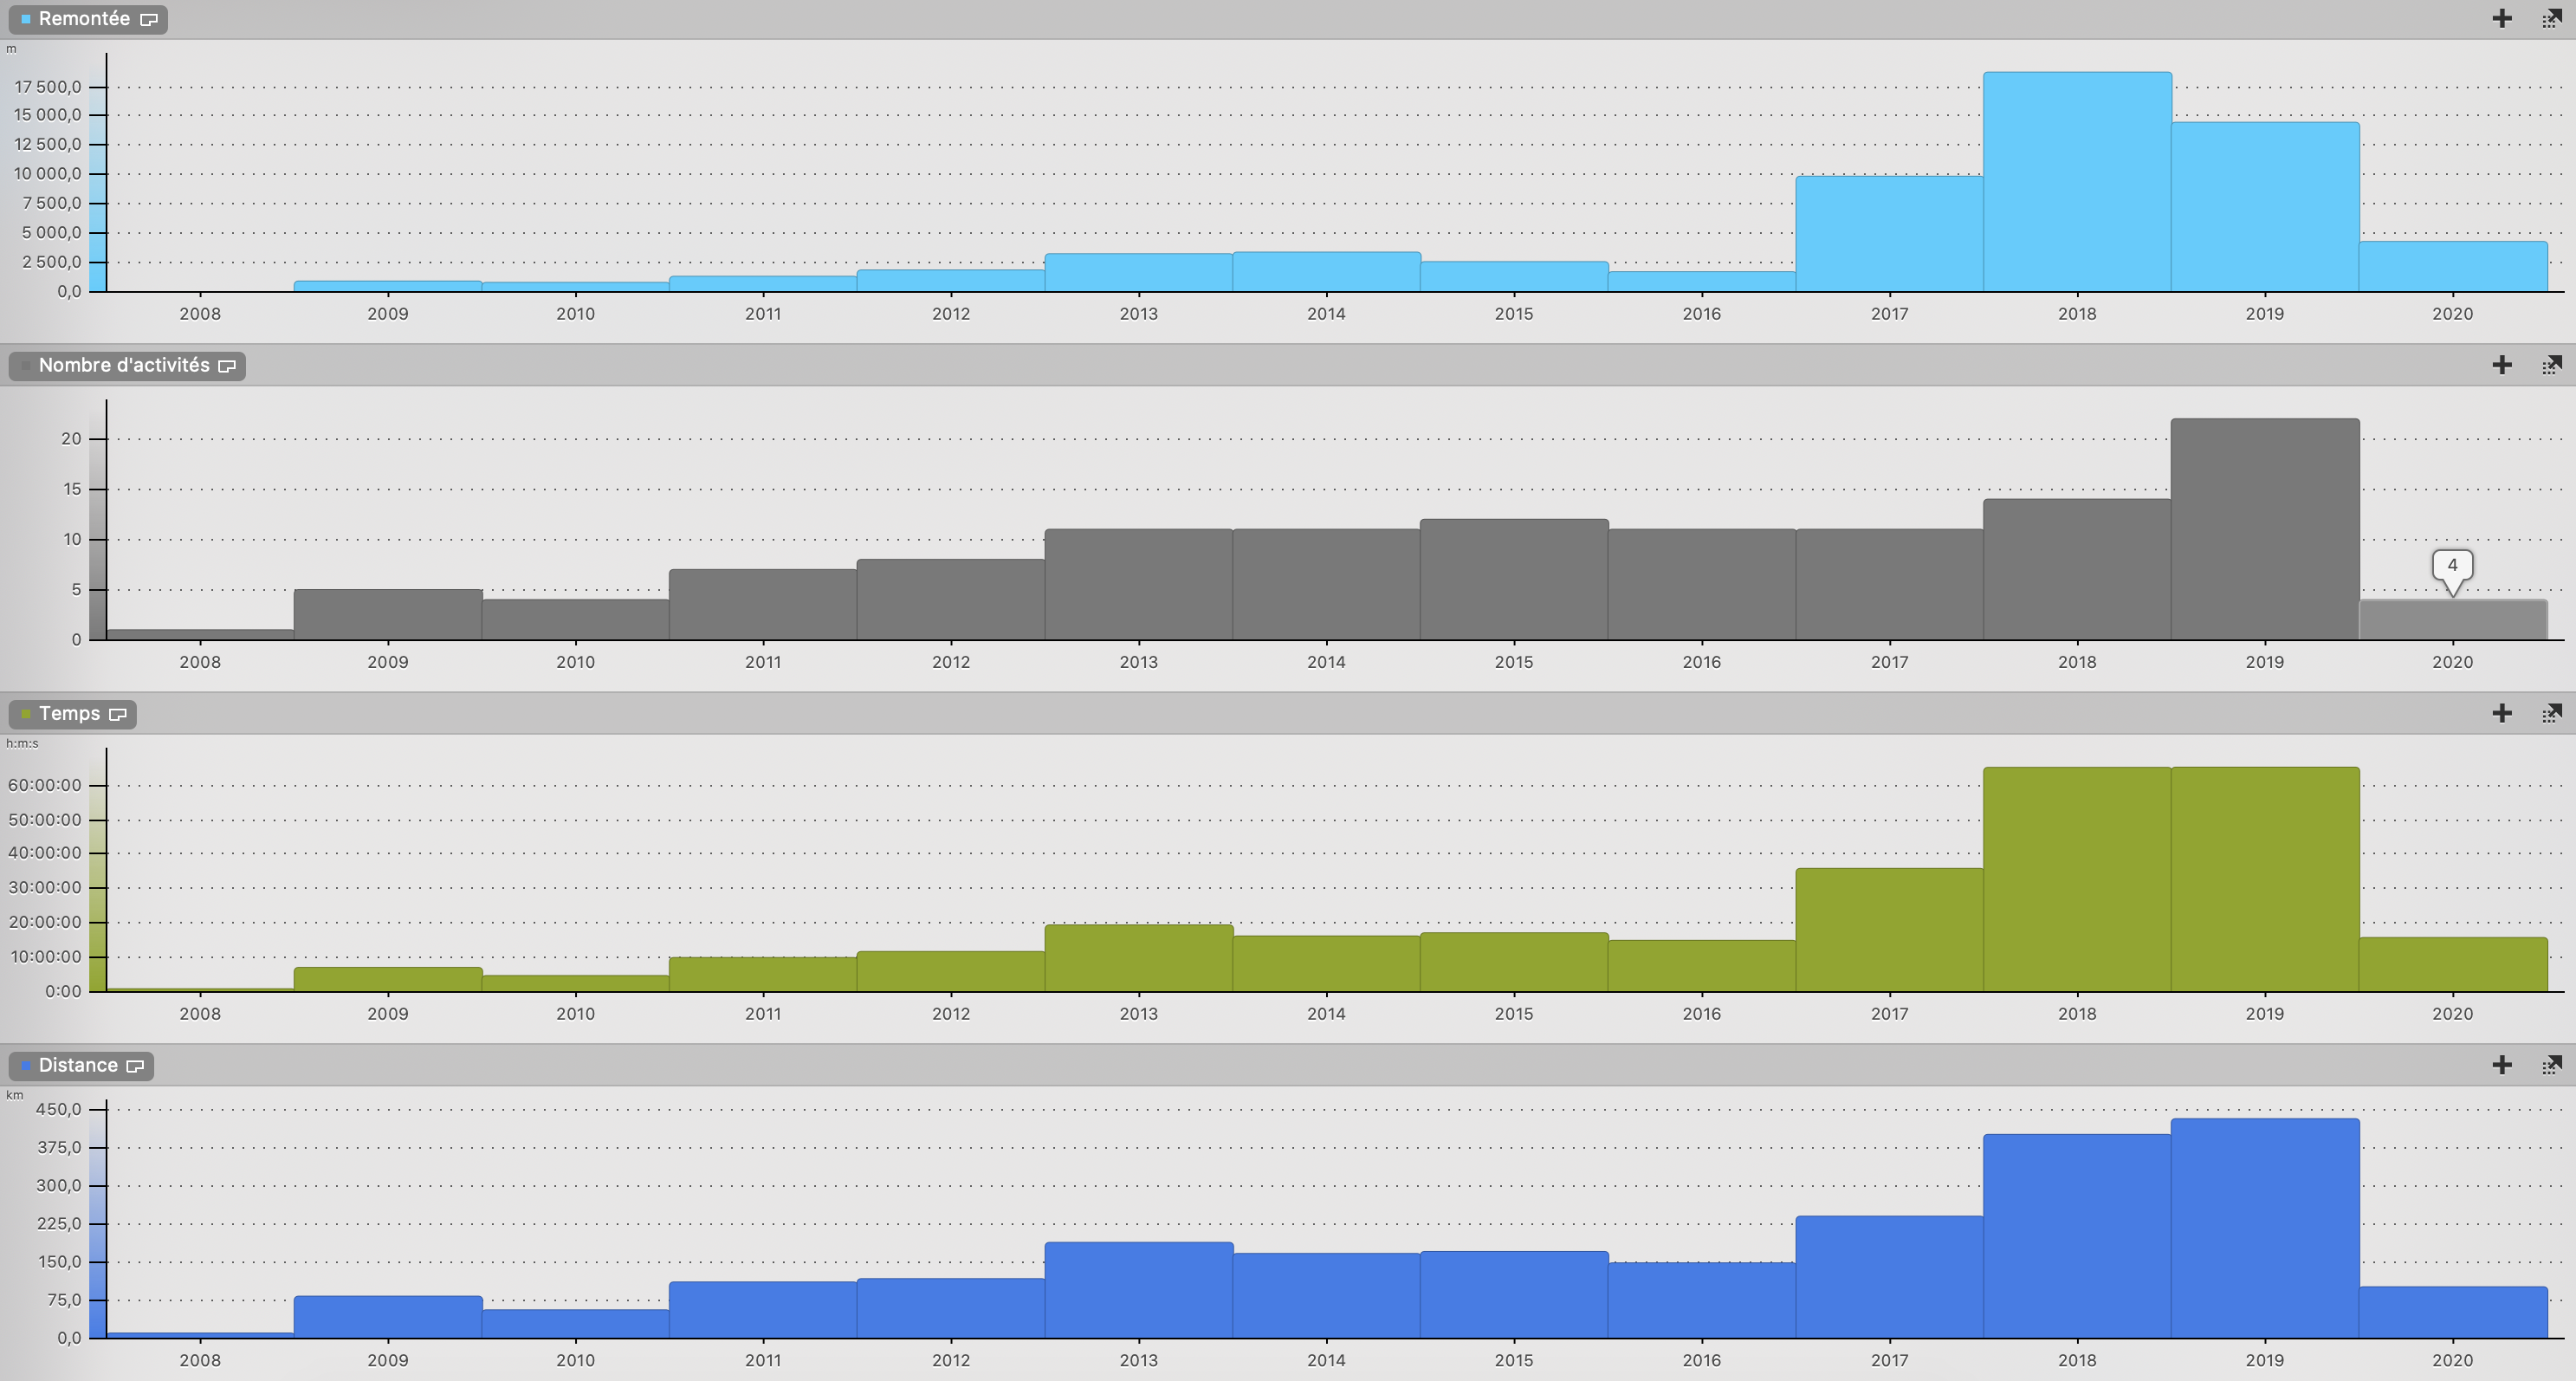
Voici donc les graphiques :
Le programme est en Python.
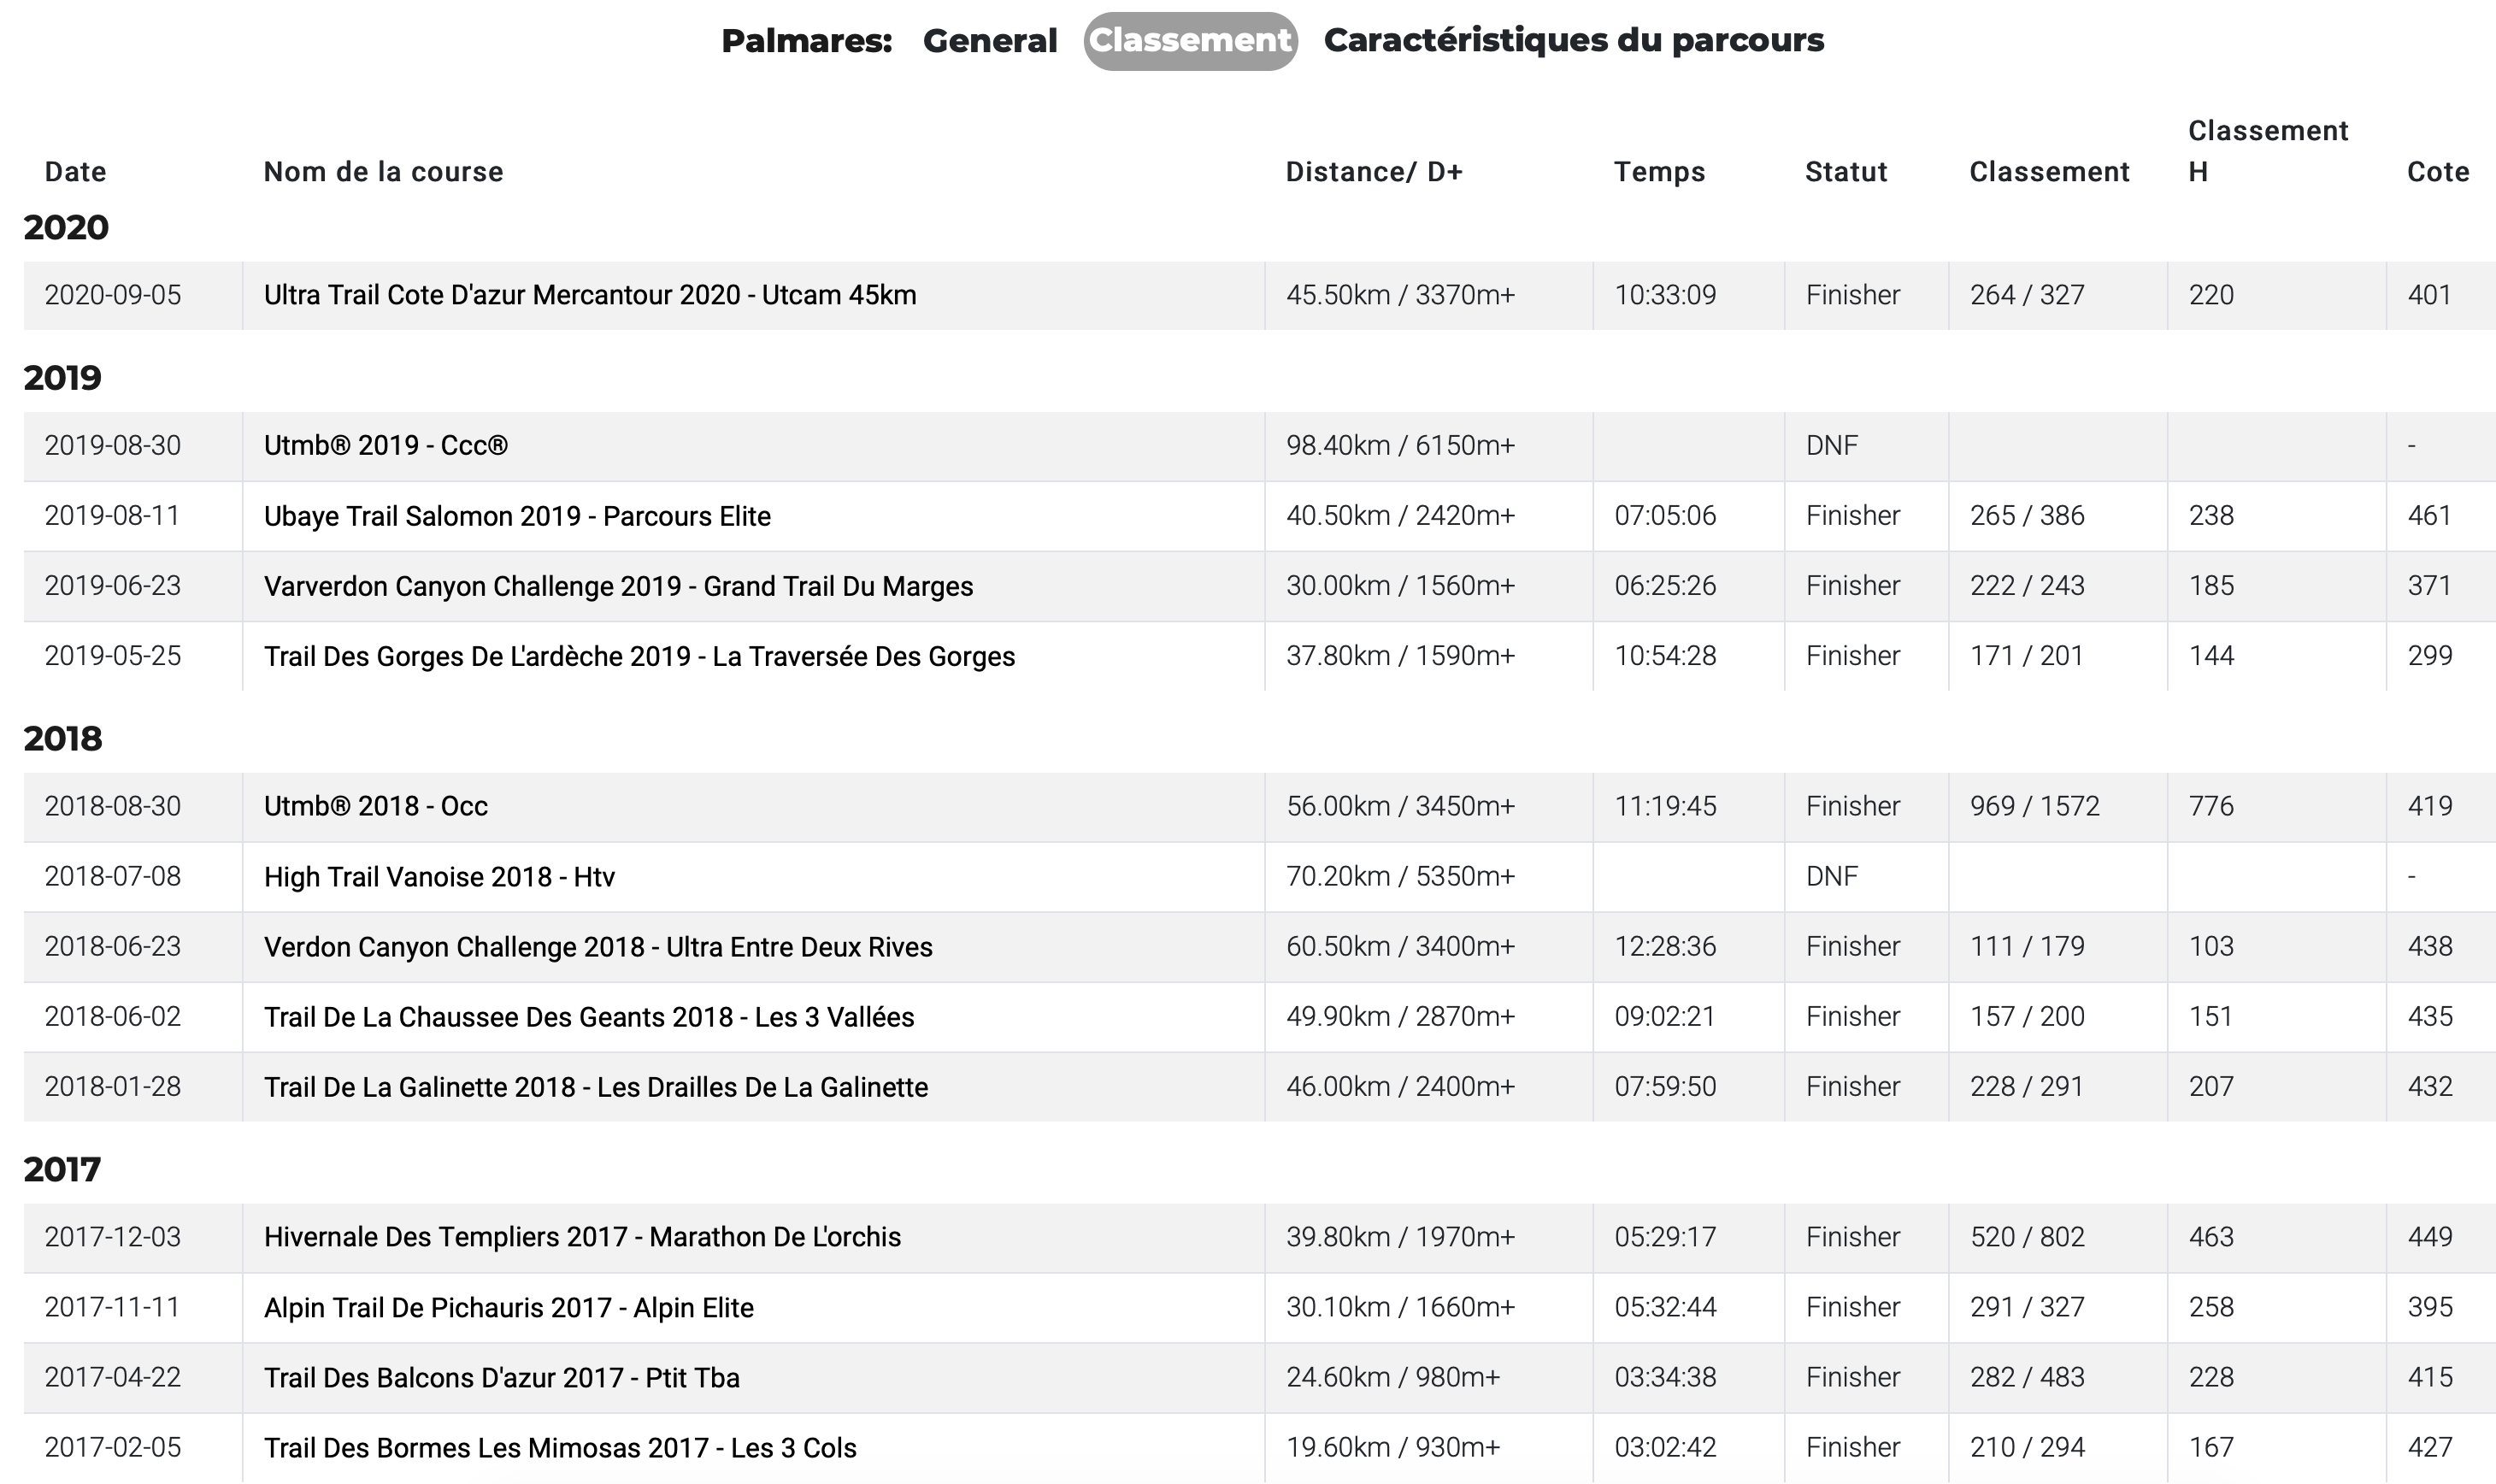
Pour la FFA :

Pour l’ITRA : https://itra.run/runners/1260843-frederic-arias
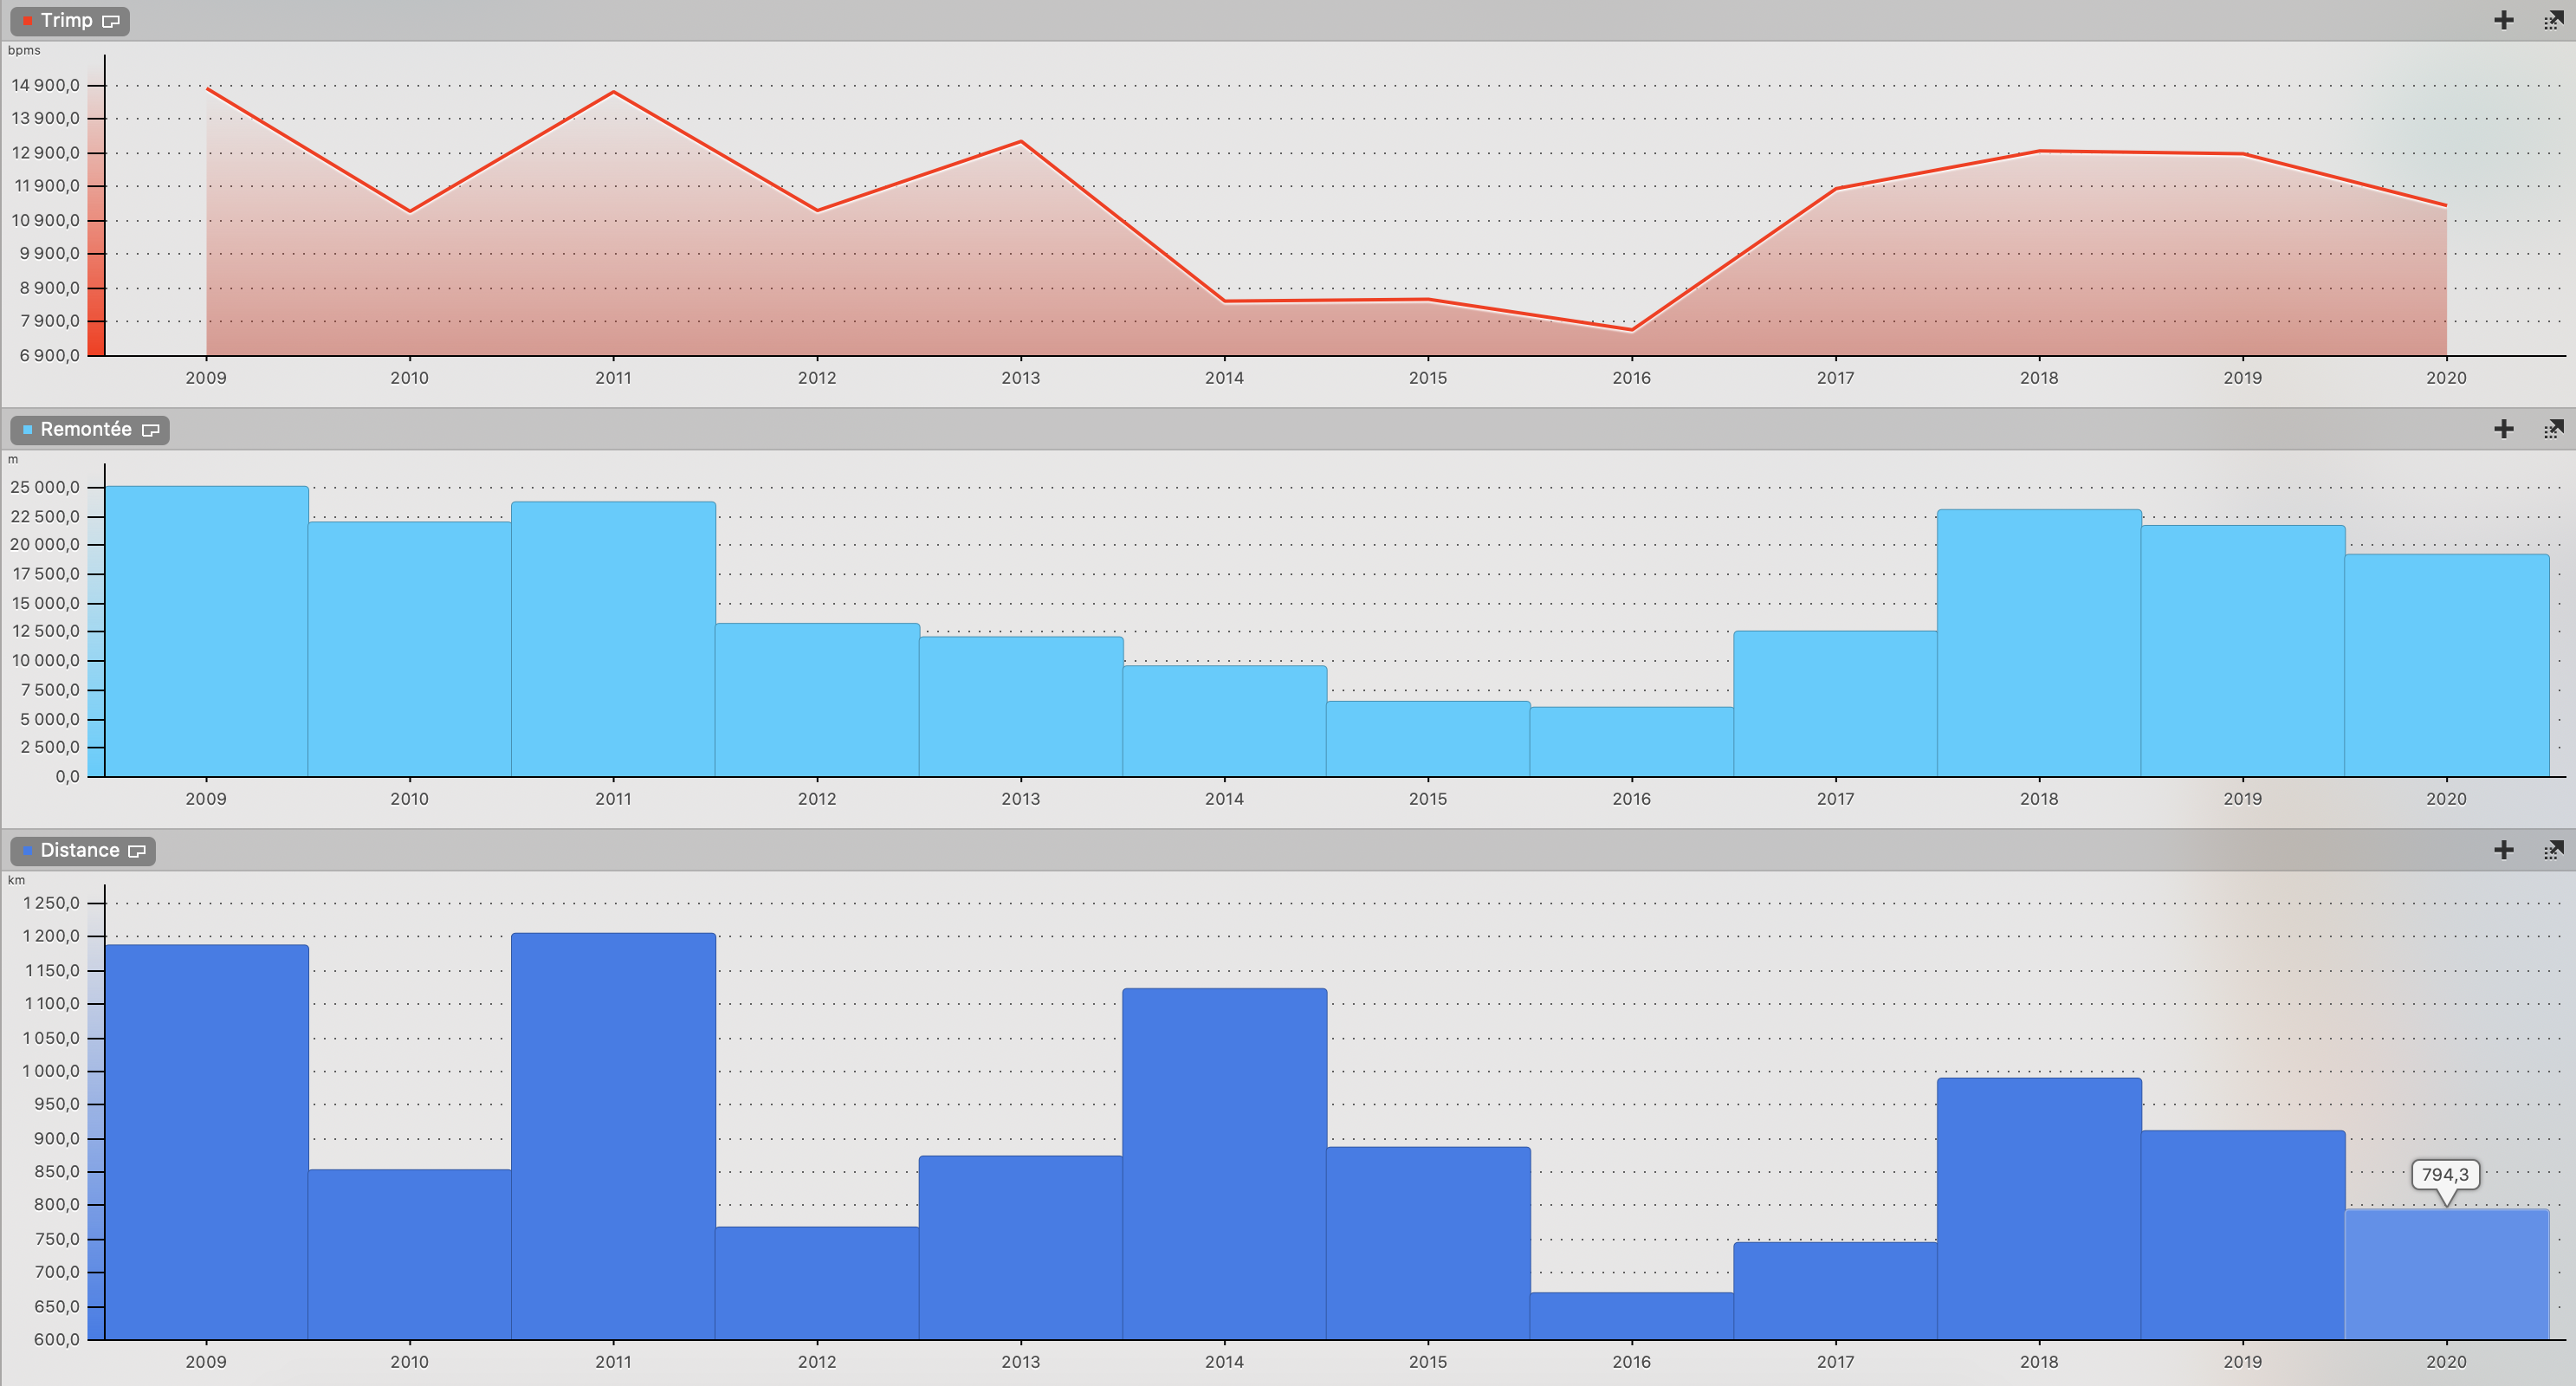
– Nombre de kilomètre de course, tapis de course, trail, course d’orientation : 794 km
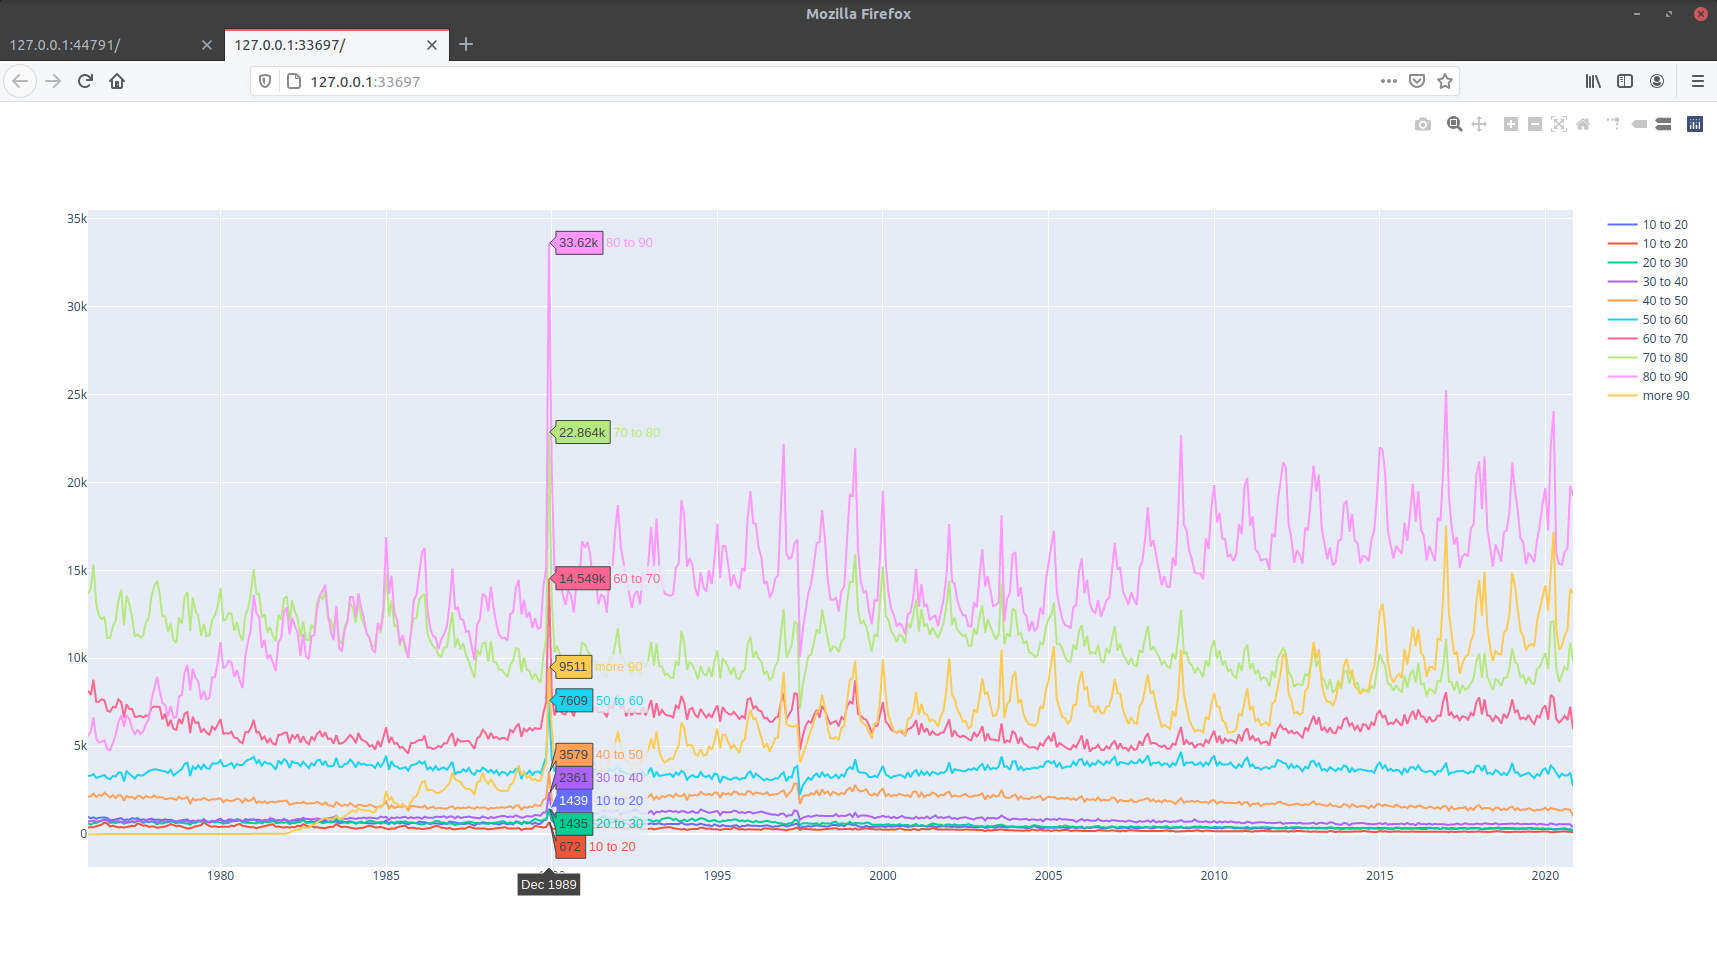
J’ai donc fait un nouveau graphique, du nombre de mort par tranche d’age avec les données de l’INSEE. (Tranche de 10 ans)
Le graphique est faux sur la fin 2020, il ne sera juste que vers mi-fevrier 2021. Quand l’INSEE aura publié les données.
Voici donc mon process :
Etape 1 : Téléchargement des données de l’INSEE : https://www.insee.fr/fr/information/4190491
Etape 2 : je mets tout sur un même fichier:
# cat deces-* Deces_2020_M* | grep -v "nomprenom" > Full.csv
# wc -l Full.csv
  25528867 Full.csv
Etape 3 : Je fais tourner un premier programme en Python :
# cat parse2.py
import csv
import datetime
from dateutil.relativedelta import relativedelta

with open('Full.csv', 'rt') as f:
    csv_reader = csv.reader(f, quotechar='"', delimiter=';', quoting=csv.QUOTE_ALL, skipinitialspace=True)

    for line in csv_reader:
        #print(line[2])
        if (len(line[2]) == 8) and (not (str(line[2]).endswith("00"))):
            try:
               start_date = datetime.datetime.strptime(line[2],"%Y%m%d");
            except:
               print("error1",line[2])
        #print(line[6])
        if (len(line[6]) == 8) and (not (str(line[6]).endswith("00"))):
             try:
               end_date = datetime.datetime.strptime(line[6],"%Y%m%d");
               age = relativedelta(end_date, start_date).years
               #print(line[6])
               year = end_date.year
               month = end_date.month
               if  age <= 10:
                   print year,",",month,", 0to10"
               if 10 < age <= 20:
                   print year,",",month,", 10to20"
               if 20 < age <= 30:
                   print year,",",month,", 20to30"
               if 30 < age <= 40:
                   print year,",",month,", 30to40"
               if 40 < age <= 50:
                   print year,",",month,", 40to50"
               if 50 < age <= 60:
                   print year,",",month,", 50to60"
               if 60 < age <= 70:
                   print year,",",month,", 60to70"
               if 70 < age <= 80:
                   print year,",",month,", 70to80"
               if 80 < age <= 90:
                   print year,",",month,", 80to90"
               if 90 < age : print year,",",month,", more90" except: print("error2",line[6]) # python parse2.py > age2.csv
Etape 4 : J’ordonne et je fais le ménage (je garde que les année 20xx):
# cat clear.bash

cat age2.csv | grep -v "error" | sort -n | uniq -c > sort-age2.csv
echo "Date,Number" > 0to10.csv
grep "0to10" sort-age2.csv | awk '{if ($4 > 9) {print  $2 "-" $4 "," $1 ;} else if ($4 < 10) {print $2 "-0" $4 "," $1 ;} }' | grep "^20" | sort -n >> 0to10.csv
echo "Date,Number" > 10to20.csv
grep "10to20" sort-age2.csv  | awk '{if ($4 > 9) {print  $2 "-" $4 "," $1 ;} else if ($4 < 10) {print $2 "-0" $4 "," $1 ;} }' | grep "^20" | sort -n >> 10to20.csv
echo "Date,Number" > 20to30.csv
grep "20to30" sort-age2.csv | awk '{if ($4 > 9) {print  $2 "-" $4 "," $1 ;} else if ($4 < 10) {print $2 "-0" $4 "," $1 ;} }' | grep "^20" | sort -n >> 20to30.csv
echo "Date,Number" > 30to40.csv
grep "30to40" sort-age2.csv | awk '{if ($4 > 9) {print  $2 "-" $4 "," $1 ;} else if ($4 < 10) {print $2 "-0" $4 "," $1 ;} }' | grep "^20" | sort -n >> 30to40.csv
echo "Date,Number" > 40to50.csv
grep "40to50" sort-age2.csv | awk '{if ($4 > 9) {print  $2 "-" $4 "," $1 ;} else if ($4 < 10) {print $2 "-0" $4 "," $1 ;} }' | grep "^20" | sort -n >> 40to50.csv
echo "Date,Number" > 50to60.csv
grep "50to60" sort-age2.csv | awk '{if ($4 > 9) {print  $2 "-" $4 "," $1 ;} else if ($4 < 10) {print $2 "-0" $4 "," $1 ;} }' | grep "^20" | sort -n >> 50to60.csv
echo "Date,Number" > 60to70.csv
grep "60to70" sort-age2.csv | awk '{if ($4 > 9) {print  $2 "-" $4 "," $1 ;} else if ($4 < 10) {print $2 "-0" $4 "," $1 ;} }' | grep "^20" | sort -n >> 60to70.csv
echo "Date,Number" > 70to80.csv
grep "70to80" sort-age2.csv | awk '{if ($4 > 9) {print  $2 "-" $4 "," $1 ;} else if ($4 < 10) {print $2 "-0" $4 "," $1 ;} }' | grep "^20" | sort -n >> 70to80.csv
echo "Date,Number" > 80to90.csv
grep "80to90" sort-age2.csv | awk '{if ($4 > 9) {print  $2 "-" $4 "," $1 ;} else if ($4 < 10) {print $2 "-0" $4 "," $1 ;} }' | grep "^20" | sort -n >> 80to90.csv
echo "Date,Number" > more90.csv
grep "more90" sort-age2.csv | awk '{if ($4 > 9) {print  $2 "-" $4 "," $1 ;} else if ($4 < 10) {print $2 "-0" $4 "," $1 ;} }' | grep "^20" | sort -n >> more90.csv

# ./clear.bash
Ou bien je garde uniquement > 1975 avec clear2.bash
cat clear2.bash

cat age2.csv | grep -v "error" | sort -n | uniq -c > sort-age2.csv
echo "Date,Number" > 0to10.csv
grep "0to10" sort-age2.csv | awk '{if ($2 > 1975) {if ($4 > 9) {print  $2 "-" $4 "," $1 ;} else if ($4 < 10) {print  $2 "-0" $4 "," $1 ;}} }'  | sort -n >> 0to10.csv
echo "Date,Number" > 10to20.csv
grep "10to20" sort-age2.csv  | awk '{if ($2 > 1975) {if ($4 > 9) {print  $2 "-" $4 "," $1 ;} else if ($4 < 10) {print  $2 "-0" $4 "," $1 ;}} }' | sort -n >> 10to20.csv
echo "Date,Number" > 20to30.csv
grep "20to30" sort-age2.csv | awk '{if ($2 > 1975) {if ($4 > 9) {print  $2 "-" $4 "," $1 ;} else if ($4 < 10) {print  $2 "-0" $4 "," $1 ;}} }' | sort -n >> 20to30.csv
echo "Date,Number" > 30to40.csv
grep "30to40" sort-age2.csv | awk '{if ($2 > 1975) {if ($4 > 9) {print  $2 "-" $4 "," $1 ;} else if ($4 < 10) {print  $2 "-0" $4 "," $1 ;}} }' | sort -n >> 30to40.csv
echo "Date,Number" > 40to50.csv
grep "40to50" sort-age2.csv | awk '{if ($2 > 1975) {if ($4 > 9) {print  $2 "-" $4 "," $1 ;} else if ($4 < 10) {print  $2 "-0" $4 "," $1 ;}} }'  | sort -n >> 40to50.csv
echo "Date,Number" > 50to60.csv
grep "50to60" sort-age2.csv | awk '{if ($2 > 1975) {if ($4 > 9) {print  $2 "-" $4 "," $1 ;} else if ($4 < 10) {print  $2 "-0" $4 "," $1 ;}} }'  | sort -n >> 50to60.csv
echo "Date,Number" > 60to70.csv
grep "60to70" sort-age2.csv | awk '{if ($2 > 1975) {if ($4 > 9) {print  $2 "-" $4 "," $1 ;} else if ($4 < 10) {print  $2 "-0" $4 "," $1 ;}} }' | sort -n >> 60to70.csv
echo "Date,Number" > 70to80.csv
grep "70to80" sort-age2.csv | awk '{if ($2 > 1975) {if ($4 > 9) {print  $2 "-" $4 "," $1 ;} else if ($4 < 10) {print  $2 "-0" $4 "," $1 ;}} }' | sort -n >> 70to80.csv
echo "Date,Number" > 80to90.csv
grep "80to90" sort-age2.csv | awk '{if ($2 > 1975) {if ($4 > 9) {print  $2 "-" $4 "," $1 ;} else if ($4 < 10) {print  $2 "-0" $4 "," $1 ;}} }'  | sort -n >> 80to90.csv
echo "Date,Number" > more90.csv
grep "more90" sort-age2.csv | awk '{if ($2 > 1975) {if ($4 > 9) {print  $2 "-" $4 "," $1 ;} else if ($4 < 10) {print  $2 "-0" $4 "," $1 ;}} }'  | sort -n >> more90.csv
Etape 5 : Je dessine :
# cat draw2.py
import plotly.graph_objects as go

import pandas as pd

fig = go.Figure()

df = pd.read_csv('./0to10.csv')
fig.add_trace(go.Scatter(x=df['Date'], y=df['Number'],name='10 to 20'))

df2 = pd.read_csv('./10to20.csv')
fig.add_trace(go.Scatter(x=df2['Date'], y=df2['Number'],name='10 to 20'))

df3 = pd.read_csv('./20to30.csv')
fig.add_trace(go.Scatter(x=df3['Date'], y=df3['Number'],name='20 to 30'))

df4 = pd.read_csv('./30to40.csv')
fig.add_trace(go.Scatter(x=df4['Date'], y=df4['Number'],name='30 to 40'))

df5 = pd.read_csv('./40to50.csv')
fig.add_trace(go.Scatter(x=df5['Date'], y=df5['Number'],name='40 to 50'))

df6 = pd.read_csv('./50to60.csv')
fig.add_trace(go.Scatter(x=df6['Date'], y=df6['Number'],name='50 to 60'))

df7 = pd.read_csv('./60to70.csv')
fig.add_trace(go.Scatter(x=df7['Date'], y=df7['Number'],name='60 to 70'))

df8 = pd.read_csv('./70to80.csv')
fig.add_trace(go.Scatter(x=df8['Date'], y=df8['Number'],name='70 to 80'))

df9 = pd.read_csv('./80to90.csv')
fig.add_trace(go.Scatter(x=df9['Date'], y=df9['Number'],name='80 to 90'))

df10 = pd.read_csv('./more90.csv')
fig.add_trace(go.Scatter(x=df10['Date'], y=df10['Number'],name='more 90'))


fig.show()

#  python3 draw2.py
Le résultat, j’ai un problème sur décembre 1989 :
Suite au changement d’abonnement chez PHPNET.ORG, j’ai le problème de chargement de fichier qui est fixé (send file IO). Le rapport est ici : https://report.wpbenchmark.io/mFVSWslG6K/ .
 Voici la configuration PHP :
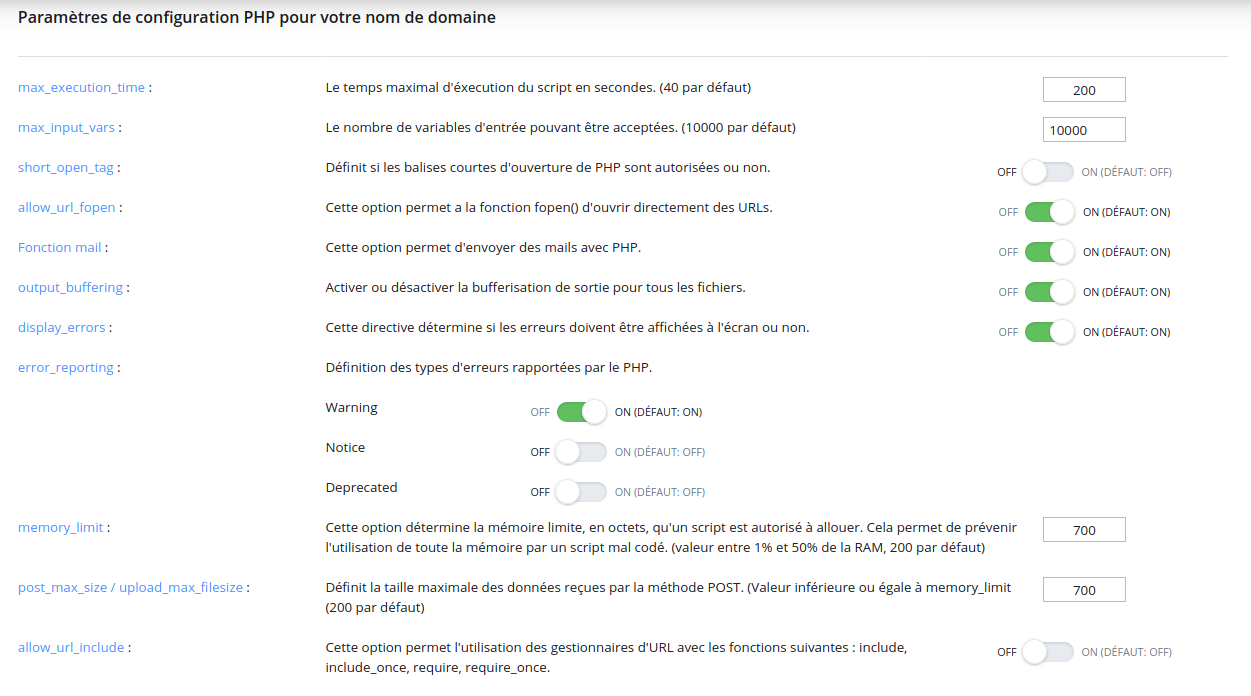 Maintenant j’ai des performances 3 fois moindres sur MySQL (je suis passé de 7,89 à 2,13). J’ai donc fixé un problème et ajouté un autre.
Misère.