Première étape : Connexion SSH sur OSMC, il suffit de regarder dans les paramètres pour trouver l’IP : .
Ensuite on fait un ssh sur l’IP avec le login osmc et le mot de passe osmc :
$ ssh osmc@192.168.0.28
osmc@192.168.0.28's password:
The programs included with the Debian GNU/Linux system are free software;
the exact distribution terms for each program are described in the
individual files in /usr/share/doc/*/copyright.
Debian GNU/Linux comes with ABSOLUTELY NO WARRANTY, to the extent
permitted by applicable law.
Updating APT cache. Please be patient.
Generating locales (this might take a while)...
  fr_FR.UTF-8... done
Generation complete.
osmc@osmc:~$
On commence par une mise à jours :
osmc@osmc:~$ sudo apt-get update
osmc@osmc:~$ df -h
Sys. de fichiers Taille Utilisé Dispo Uti% Monté sur
devtmpfs 362M 0 362M 0% /dev
tmpfs 367M 19M 348M 6% /run
/dev/mmcblk0p2 29G 2,1G 26G 8% /
tmpfs 367M 0 367M 0% /dev/shm
tmpfs 5,0M 0 5,0M 0% /run/lock
tmpfs 367M 0 367M 0% /sys/fs/cgroup
/dev/mmcblk0p1 240M 22M 219M 9% /boot
tmpfs 74M 0 74M 0% /run/user/1000
root@osmc:~# lsblk
NAME MAJ:MIN RM SIZE RO TYPE MOUNTPOINT
sda 8:0 0 111,8G 0 disk
mmcblk0 179:0 0 29,7G 0 disk
├─mmcblk0p1 179:1 0 243M 0 part /boot
└─mmcblk0p2 179:2 0 29,5G 0 part /
root@osmc:~# sudo apt install rsync
....
root@osmc:~# sudo fdisk /dev/sda
Welcome to fdisk (util-linux 2.25.2).
Changes will remain in memory only, until you decide to write them.
Be careful before using the write command.
Device does not contain a recognized partition table.
Created a new DOS disklabel with disk identifier 0x64f9ca91.
Command (m for help): p
Disk /dev/sda: 111,8 GiB, 120034123776 bytes, 234441648 sectors
Units: sectors of 1 * 512 = 512 bytes
Sector size (logical/physical): 512 bytes / 512 bytes
I/O size (minimum/optimal): 512 bytes / 512 bytes
Disklabel type: dos
Disk identifier: 0x64f9ca91
Command (m for help): d
No partition is defined yet!
Could not delete partition 1995033425
Command (m for help): w
The partition table has been altered.
Calling ioctl() to re-read partition table.
Syncing disks.
root@osmc:~# sudo fdisk /dev/sda
Welcome to fdisk (util-linux 2.25.2).
Changes will remain in memory only, until you decide to write them.
Be careful before using the write command.
Device does not contain a recognized partition table.
Created a new DOS disklabel with disk identifier 0x7ac27f0a.
Command (m for help): n
Partition type
p primary (0 primary, 0 extended, 4 free)
e extended (container for logical partitions)
Select (default p): p
Partition number (1-4, default 1): 1
First sector (2048-234441647, default 2048):
Last sector, +sectors or +size{K,M,G,T,P} (2048-234441647, default 234441647):
Created a new partition 1 of type 'Linux' and of size 111,8 GiB.
Command (m for help): w
The partition table has been altered.
Calling ioctl() to re-read partition table.
Syncing disks.
root@osmc:~# sudo mke2fs -t ext4 -L rootfs /dev/sda1
mke2fs 1.42.12 (29-Aug-2014)
En train de créer un système de fichiers avec 29304950 4k blocs et 7331840 i-noeuds.
UUID de système de fichiers=c8478b72-fcaf-4dc7-87a7-5156cc19efab
Superblocs de secours stockés sur les blocs :
32768, 98304, 163840, 229376, 294912, 819200, 884736, 1605632, 2654208,
4096000, 7962624, 11239424, 20480000, 23887872
Allocation des tables de groupe : complété
Écriture des tables d'i-noeuds : complété
Création du journal (32768 blocs) : complété
Écriture des superblocs et de l'information de comptabilité du système de
fichiers : complété
root@osmc:~# sudo mount /dev/sda1 /mnt
--> Arrêt de tous les services, pour avoir la liste : root@osmc:~# service --status-all
root@osmc:~# sudo rsync -avx / /mnt
sending incremental file list
...
--> 6 heures de copie !
...
sent 1,258,978,550 bytes received 742,144 bytes 91,619.38 bytes/sec
total size is 2,002,639,532 speedup is 1.59
...
..
osmc@osmc:~$ df -h
Sys. de fichiers Taille Utilisé Dispo Uti% Monté sur
devtmpfs 362M 0 362M 0% /dev
tmpfs 367M 38M 330M 11% /run
/dev/mmcblk0p2 29G 2,2G 26G 8% /
tmpfs 367M 0 367M 0% /dev/shm
tmpfs 5,0M 0 5,0M 0% /run/lock
tmpfs 367M 0 367M 0% /sys/fs/cgroup
/dev/mmcblk0p1 240M 22M 219M 9% /boot
/dev/sda1 110G 2,2G 103G 3% /mnt
tmpfs 74M 0 74M 0% /run/user/1000
osmc@osmc:~$ sudo cp /boot/cmdline.txt /boot/cmdline.txt.orig
osmc@osmc:~$ cat /boot/cmdline.txt
root=/dev/mmcblk0p2 rootfstype=ext4 rootwait quiet osmcdev=rbp2
osmc@osmc:~$ sudo vi /boot/cmdline.txt
osmc@osmc:~$ cat /boot/cmdline.txt
root=/dev/sda1 rootfstype=ext4 rootwait quiet osmcdev=rbp2
osmc@osmc:~$ cat /mnt/etc/fstab
/dev/mmcblk0p1 /boot vfat defaults,noatime 0 0
/dev/sda1 / ext4 defaults,noatime 0 0/dev/mmcblk0p2 /old ext4 defaults,noatime 0 0
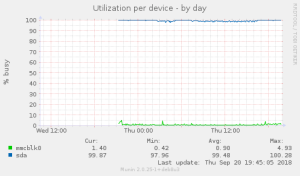
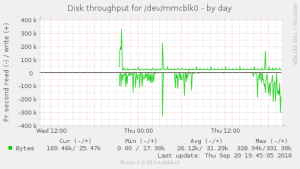
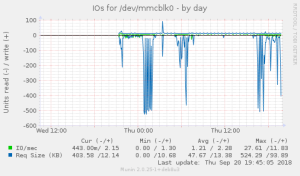
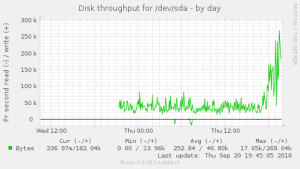
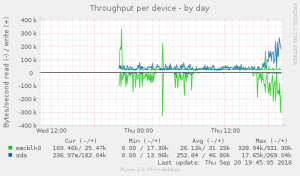
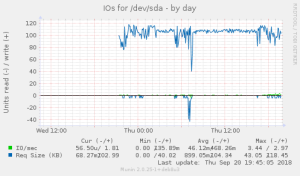
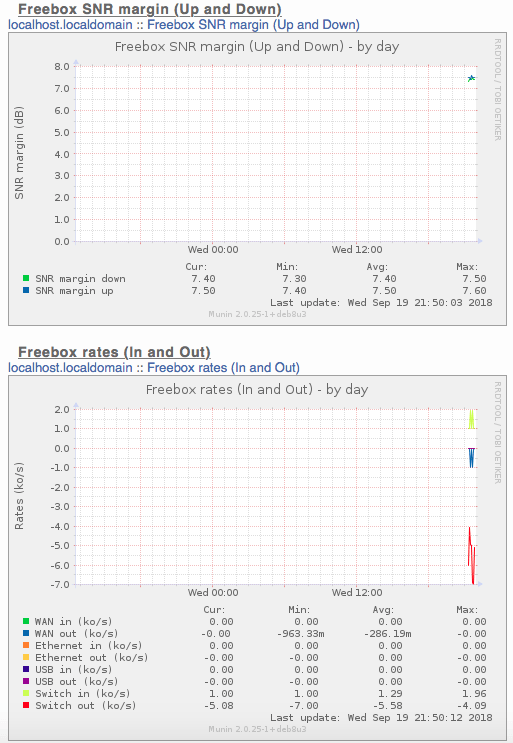
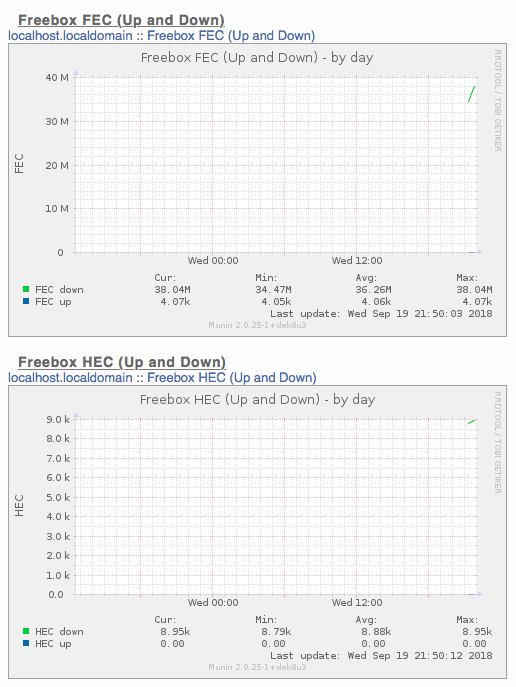
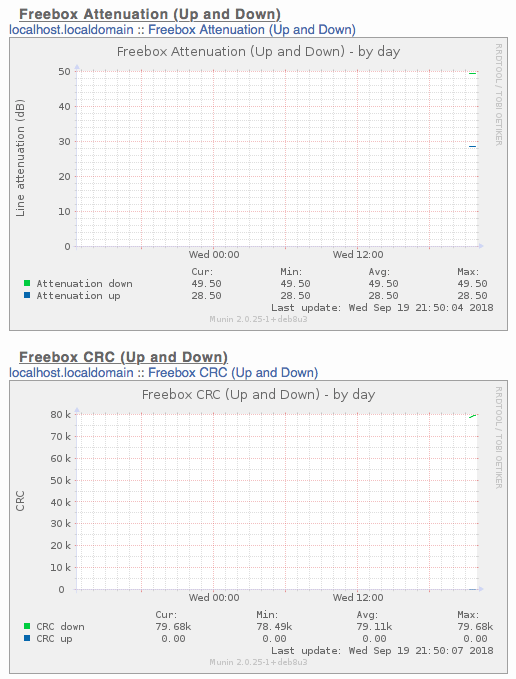
Quelques statistiques sur le disque SSD & la SD Card (avant le reboot):
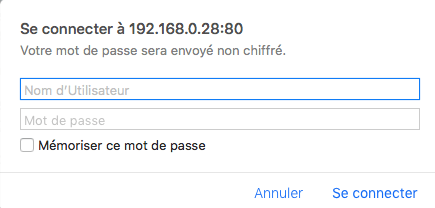
On peut ajouter un couche de sécurité via htaccess …
Attention il faut aussi installer bc :
$ sudo apt-get install bc
Sinon on a une erreur :
2018/09/21-19:10:12 [5846] Error output from freeboxv5_uptime:
2018/09/21-19:10:12 [5846]      /etc/munin/plugins/freeboxv5_uptime: line 143: bc: command not found
# sudo service elasticsearch start
# sudo service elasticsearch status
● elasticsearch.service - Elasticsearch
   Loaded: loaded (/usr/lib/systemd/system/elasticsearch.service; disabled)
   Active: failed (Result: exit-code) since mer. 2018-09-19 18:07:39 UTC; 2s ago
     Docs: http://www.elastic.co
  Process: 5873 ExecStart=/usr/share/elasticsearch/bin/elasticsearch -p ${PID_DIR}/elasticsearch.pid --quiet -Edefault.path.logs=${LOG_DIR} -Edefault.path.data=${DATA_DIR} -Edefault.path.conf=${CONF_DIR} (code=exited, status=1/FAILURE)
  Process: 5869 ExecStartPre=/usr/share/elasticsearch/bin/elasticsearch-systemd-pre-exec (code=exited, status=0/SUCCESS)
 Main PID: 5873 (code=exited, status=1/FAILURE)

sept. 19 18:07:39 osmc elasticsearch[5873]: Error occurred during initialization of VM
sept. 19 18:07:39 osmc elasticsearch[5873]: Could not reserve enough space for 2097152KB object heap
sept. 19 18:07:39 osmc systemd[1]: elasticsearch.service: main process exited, code=exited, status=1/FAILURE
sept. 19 18:07:39 osmc systemd[1]: Unit elasticsearch.service entered failed state.
Misère … JAVA commence à me gonfler … Modification du fichier /etc/elasticsearch/jvm.options :
# cat /etc/elasticsearch/jvm.options  | grep Xm
## -Xms4g
## -Xmx4g
# Xms represents the initial size of total heap space
# Xmx represents the maximum size of total heap space
#-Xms2g
-Xms200m
#-Xmx2g
-Xmx500m
Nouveau test :
# sudo service elasticsearch start
# sudo service elasticsearch status
● elasticsearch.service - Elasticsearch
   Loaded: loaded (/usr/lib/systemd/system/elasticsearch.service; disabled)
   Active: active (running) since mer. 2018-09-19 18:11:26 UTC; 3s ago
     Docs: http://www.elastic.co
  Process: 5940 ExecStartPre=/usr/share/elasticsearch/bin/elasticsearch-systemd-pre-exec (code=exited, status=0/SUCCESS)
 Main PID: 5944 (java)
   CGroup: /system.slice/elasticsearch.service
           └─5944 /usr/bin/java -Xms200m -Xmx500m -XX:+UseConcMarkSweepGC -XX:CMSInitiatingOccupancyFraction=75 -XX:+UseCMSInitiatingOccupancyOnly -XX:+AlwaysPreTouch -server -Xss1m -Djava....
Etape n°4 : Installation de logstash :
# sudo wget https://artifacts.elastic.co/downloads/logstash/logstash-5.5.2.deb
# sudo dpkg -i logstash-5.5.2.deb
Sélection du paquet logstash précédemment désélectionné.
(Lecture de la base de données... 26506 fichiers et répertoires déjà installés.)
Préparation du dépaquetage de logstash-5.5.2.deb ...
Dépaquetage de logstash (1:5.5.2-1) ...
Paramétrage de logstash (1:5.5.2-1) ...
Using provided startup.options file: /etc/logstash/startup.options
Java HotSpot(TM) Client VM warning: TieredCompilation is disabled in this release.
io/console on JRuby shells out to stty for most operations
/usr/share/logstash/vendor/bundle/jruby/1.9/gems/pleaserun-0.0.30/lib/pleaserun/installer.rb:46 warning: executable? does not in this environment and will return a dummy value
Successfully created system startup script for Logstash
Etape n°5 : Installation de JFFI :
# sudo apt-get install ant
# sudo apt-get install git
# sudo git clone https://github.com/jnr/jffi.git
# cd jffi
# sudo ant jar
# sudo ant jar
Buildfile: /root/jffi/build.xml

-pre-init:

-init-vars:
    [mkdir] Created dir: /root/jffi/build/jni

-post-init:

-init:

-pre-jar:

-pre-compile:

-do-compile:
    [mkdir] Created dir: /root/jffi/build/classes
    [javac] Compiling 42 source files to /root/jffi/build/classes
    [javac] warning: [options] bootstrap class path not set in conjunction with -source 1.6
    [javac] /root/jffi/src/main/java/com/kenai/jffi/MemoryIO.java:847: warning: Unsafe is internal proprietary API and may be removed in a future release
    [javac]         protected static sun.misc.Unsafe unsafe = sun.misc.Unsafe.class.cast(getUnsafe());
    [javac]                                  ^
    [javac] /root/jffi/src/main/java/com/kenai/jffi/MemoryIO.java:847: warning: Unsafe is internal proprietary API and may be removed in a future release
    [javac]         protected static sun.misc.Unsafe unsafe = sun.misc.Unsafe.class.cast(getUnsafe());
    [javac]                                                           ^
    [javac] Note: /root/jffi/src/main/java/com/kenai/jffi/ClosureMagazine.java uses or overrides a deprecated API.
    [javac] Note: Recompile with -Xlint:deprecation for details.
    [javac] Note: Some input files use unchecked or unsafe operations.
    [javac] Note: Recompile with -Xlint:unchecked for details.
    [javac] 3 warnings

-generate-version-source:
     [echo] Generating Version.java
    [mkdir] Created dir: /root/jffi/build/java/com/kenai/jffi

-generate-version:
    [javac] Compiling 1 source file to /root/jffi/build/classes
    [javac] warning: [options] bootstrap class path not set in conjunction with -source 1.6
    [javac] 1 warning

-compile-java:

-generate-native-headers:

-build-native-library:

BUILD FAILED
/root/jffi/build.xml:344: Execute failed: java.io.IOException: Cannot run program "make": error=2, Aucun fichier ou dossier de ce type
	at java.lang.ProcessBuilder.start(ProcessBuilder.java:1048)
	at java.lang.Runtime.exec(Runtime.java:620)
	at org.apache.tools.ant.taskdefs.launcher.Java13CommandLauncher.exec(Java13CommandLauncher.java:58)
	at org.apache.tools.ant.taskdefs.Execute.launch(Execute.java:428)
	at org.apache.tools.ant.taskdefs.Execute.execute(Execute.java:442)
	at org.apache.tools.ant.taskdefs.ExecTask.runExecute(ExecTask.java:628)
	at org.apache.tools.ant.taskdefs.ExecTask.runExec(ExecTask.java:669)
	at org.apache.tools.ant.taskdefs.ExecTask.execute(ExecTask.java:495)
	at org.apache.tools.ant.UnknownElement.execute(UnknownElement.java:292)
	at sun.reflect.GeneratedMethodAccessor4.invoke(Unknown Source)
	at sun.reflect.DelegatingMethodAccessorImpl.invoke(DelegatingMethodAccessorImpl.java:43)
	at java.lang.reflect.Method.invoke(Method.java:498)
	at org.apache.tools.ant.dispatch.DispatchUtils.execute(DispatchUtils.java:106)
	at org.apache.tools.ant.Task.perform(Task.java:348)
	at org.apache.tools.ant.Target.execute(Target.java:435)
	at org.apache.tools.ant.Target.performTasks(Target.java:456)
	at org.apache.tools.ant.Project.executeSortedTargets(Project.java:1393)
	at org.apache.tools.ant.Project.executeTarget(Project.java:1364)
	at org.apache.tools.ant.helper.DefaultExecutor.executeTargets(DefaultExecutor.java:41)
	at org.apache.tools.ant.Project.executeTargets(Project.java:1248)
	at org.apache.tools.ant.Main.runBuild(Main.java:851)
	at org.apache.tools.ant.Main.startAnt(Main.java:235)
	at org.apache.tools.ant.launch.Launcher.run(Launcher.java:280)
	at org.apache.tools.ant.launch.Launcher.main(Launcher.java:109)
Caused by: java.io.IOException: error=2, Aucun fichier ou dossier de ce type
	at java.lang.UNIXProcess.forkAndExec(Native Method)
	at java.lang.UNIXProcess.(UNIXProcess.java:247)
	at java.lang.ProcessImpl.start(ProcessImpl.java:134)
	at java.lang.ProcessBuilder.start(ProcessBuilder.java:1029)
	... 23 more

Total time: 11 seconds
On va essayer un plan B :
# sudo apt-get install zip
# cd /usr/share/logstash/vendor/jruby/lib
sudo zip -g jruby.jar jni/arm-Linux/libjffi-1.2.so
updating: jni/arm-Linux/libjffi-1.2.so
	zip warning: Local Entry CRC does not match CD: jni/arm-Linux/libjffi-1.2.so
 (deflated 63%)
Je croise les doigts … lancement :
# sudo service logstash start
# sudo service logstash status
● logstash.service - logstash
   Loaded: loaded (/etc/systemd/system/logstash.service; disabled)
   Active: active (running) since mer. 2018-09-19 18:33:29 UTC; 9s ago
 Main PID: 6431 (java)
   CGroup: /system.slice/logstash.service
           └─6431 /usr/bin/java -XX:+UseParNewGC -XX:+UseConcMarkSweepGC -XX:CMSInitiatingOccupancyFraction=75 -XX:+UseCMSInitiatingOccupancyOnly -XX:+DisableExplicitGC -Djava.awt.headless=...
# sudo service kibana start
# sudo service kibana status
● kibana.service - Kibana
   Loaded: loaded (/etc/systemd/system/kibana.service; disabled)
   Active: active (running) since mer. 2018-09-19 18:50:09 UTC; 2s ago
 Main PID: 7396 (node)
   CGroup: /system.slice/kibana.service
           └─7396 /opt/kibana/kibana-5.5.2-linux-x86/bin/../node/bin/node --no-warnings /opt/kibana/kibana-5.5.2-linux-x86/bin/../src/cli
Etape n°6 : Installation de NGinx :
# sudo apt-get install nginx apache2-utils
# sudo htpasswd -c /etc/nginx/htpasswd.users kibana_admin
New password:
Re-type new password:
Adding password for user kibana_admin
Modification de /etc/nginx/sites-available/default :
Etape n°7 : Lancement de tous les services :
root@osmc:~# sudo service logstash restart && sudo service elasticsearch restart && sudo service kibana restart && sudo service nginx start
root@osmc:~# sudo service logstash status

● logstash.service - logstash
   Loaded: loaded (/etc/systemd/system/logstash.service; disabled)
   Active: active (running) since mer. 2018-09-19 18:56:55 UTC; 1min 25s ago
 Main PID: 7933 (java)
   CGroup: /system.slice/logstash.service
           └─7933 /usr/bin/java -XX:+UseParNewGC -XX:+UseConcMarkSweepGC -XX:CMSInitiatingOccupancyFraction=75 -XX:+UseCMSInitiatingOccupancyOnly -XX:+DisableExplicitGC -Djava.awt.headless=...
root@osmc:~#
root@osmc:~# sudo service elasticsearch status
● elasticsearch.service - Elasticsearch
   Loaded: loaded (/usr/lib/systemd/system/elasticsearch.service; disabled)
   Active: failed (Result: signal) since mer. 2018-09-19 18:58:30 UTC; 49s ago
     Docs: http://www.elastic.co
  Process: 7960 ExecStart=/usr/share/elasticsearch/bin/elasticsearch -p ${PID_DIR}/elasticsearch.pid --quiet -Edefault.path.logs=${LOG_DIR} -Edefault.path.data=${DATA_DIR} -Edefault.path.conf=${CONF_DIR} (code=killed, signal=KILL)
  Process: 7956 ExecStartPre=/usr/share/elasticsearch/bin/elasticsearch-systemd-pre-exec (code=exited, status=0/SUCCESS)
 Main PID: 7960 (code=killed, signal=KILL)

sept. 19 18:58:30 osmc systemd[1]: elasticsearch.service: main process exited, code=killed, status=9/KILL
sept. 19 18:58:30 osmc systemd[1]: Unit elasticsearch.service entered failed state.
root@osmc:~# sudo service kibana status
● kibana.service - Kibana
   Loaded: loaded (/etc/systemd/system/kibana.service; disabled)
   Active: active (running) since mer. 2018-09-19 18:56:55 UTC; 2min 40s ago
 Main PID: 7985 (node)
   CGroup: /system.slice/kibana.service
           └─7985 /opt/kibana/kibana-5.5.2-linux-x86/bin/../node/bin/node --no-warnings /opt/kibana/kibana-5.5.2-linux-x86/bin/../src/cli
root@osmc:~# sudo service nginx status
● nginx.service - A high performance web server and a reverse proxy server
   Loaded: loaded (/lib/systemd/system/nginx.service; enabled)
   Active: active (running) since mer. 2018-09-19 18:54:47 UTC; 4min 59s ago
 Main PID: 7783 (nginx)
   CGroup: /system.slice/nginx.service
           ├─7783 nginx: master process /usr/sbin/nginx -g daemon on; master_process on;
           ├─7784 nginx: worker process
           ├─7785 nginx: worker process
           ├─7786 nginx: worker process
           └─7787 nginx: worker process
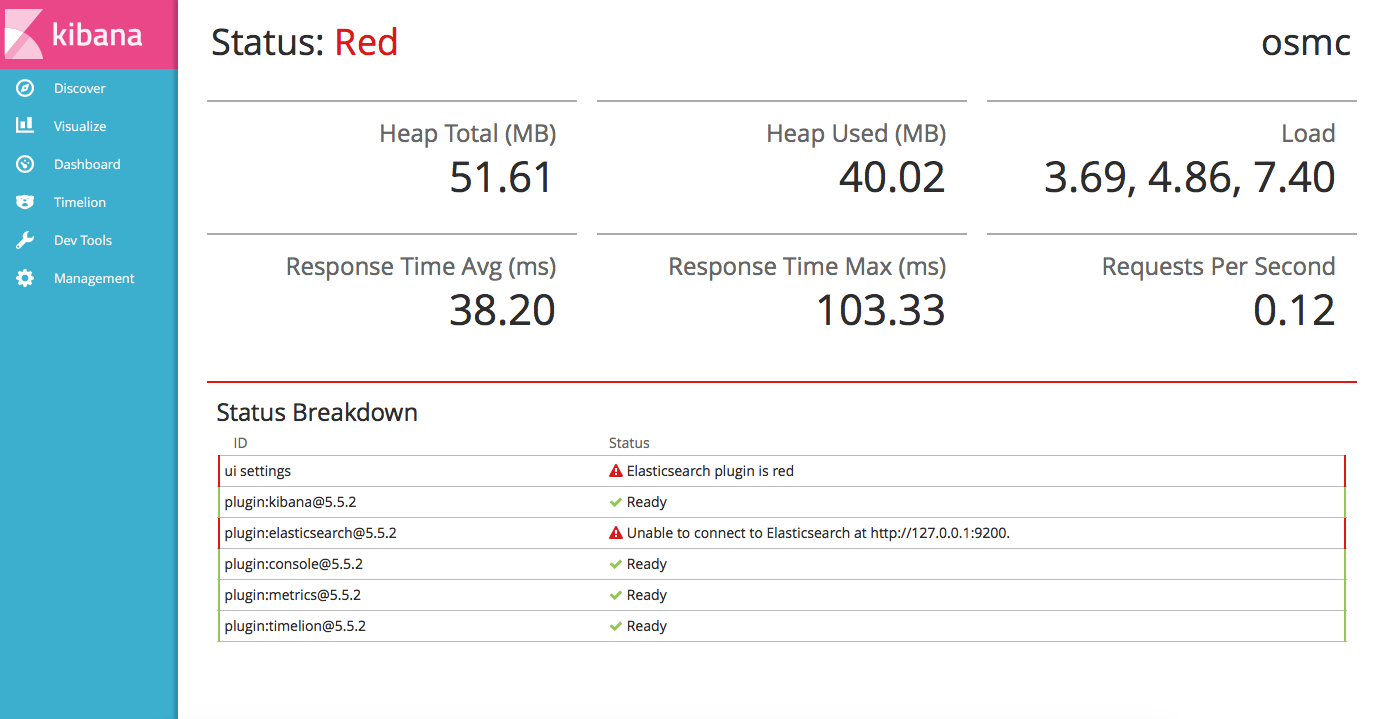
Il y en a 1/4 qui ne fonctionne pas … Misère.
root@osmc:~# sudo service elasticsearch start
root@osmc:~# sudo service elasticsearch status
● elasticsearch.service - Elasticsearch
   Loaded: loaded (/usr/lib/systemd/system/elasticsearch.service; disabled)
   Active: active (running) since mer. 2018-09-19 19:00:04 UTC; 43s ago
     Docs: http://www.elastic.co
  Process: 8208 ExecStartPre=/usr/share/elasticsearch/bin/elasticsearch-systemd-pre-exec (code=exited, status=0/SUCCESS)
 Main PID: 8213 (java)
   CGroup: /system.slice/elasticsearch.service
           └─8213 /usr/bin/java -Xms200m -Xmx500m -XX:+UseConcMarkSweepGC -XX:CMSInitiatingOccupancyFraction=75 -XX:+UseCMSInitiatingOccupancyOnly -XX:+AlwaysPreTouch -server -Xss1m -Djava...
Vive le Java … et ensuite il plante, sans laisser trop de logs :
root@osmc:~# tail -f /var/log/elasticsearch/elasticsearch.log
[2018-09-19T19:00:44,349][INFO ][o.e.n.Node               ] initialized
[2018-09-19T19:00:44,350][INFO ][o.e.n.Node               ] [feSXsTX] starting ...
[2018-09-19T19:00:45,591][INFO ][o.e.t.TransportService   ] [feSXsTX] publish_address {127.0.0.1:9300}, bound_addresses {127.0.0.1:9300}
[2018-09-19T19:00:45,699][WARN ][o.e.b.BootstrapChecks    ] [feSXsTX] initial heap size [209715200] not equal to maximum heap size [524288000]; this can cause resize pauses and prevents mlockall from locking the entire heap
[2018-09-19T19:00:45,700][WARN ][o.e.b.BootstrapChecks    ] [feSXsTX] system call filters failed to install; check the logs and fix your configuration or disable system call filters at your own risk
[2018-09-19T19:00:48,977][INFO ][o.e.c.s.ClusterService   ] [feSXsTX] new_master {feSXsTX}{feSXsTXeQw-AEPi_pWmySw}{FlzLJ3stTwO--_vZD3nxLw}{127.0.0.1}{127.0.0.1:9300}, reason: zen-disco-elected-as-master ([0] nodes joined)
[2018-09-19T19:00:49,201][INFO ][o.e.h.n.Netty4HttpServerTransport] [feSXsTX] publish_address {127.0.0.1:9200}, bound_addresses {127.0.0.1:9200}
[2018-09-19T19:00:49,202][INFO ][o.e.n.Node               ] [feSXsTX] started
[2018-09-19T19:00:50,662][INFO ][o.e.g.GatewayService     ] [feSXsTX] recovered [1] indices into cluster_state
[2018-09-19T19:00:54,270][INFO ][o.e.c.r.a.AllocationService] [feSXsTX] Cluster health status changed from [RED] to [YELLOW] (reason: [shards started [[.kibana][0]] ...]).
J’ai donc fait un changement sur la mémoire :
[2018-09-19T19:08:50,943][INFO ][o.e.n.Node               ] JVM arguments [-Xms100m, -Xmx300m, -XX:+UseConcMarkSweepGC, -XX:CMSInitiatingOccupancyFraction=75, -XX:+UseCMSInitiatingOccupancyOnly, -XX:+AlwaysPreTouch, -Xss1m, -Djava.awt.headless=true, -Dfile.encoding=UTF-8, -Djna.nosys=true, -Djdk.io.permissionsUseCanonicalPath=true, -Dio.netty.noUnsafe=true, -Dio.netty.noKeySetOptimization=true, -Dio.netty.recycler.maxCapacityPerThread=0, -Dlog4j.shutdownHookEnabled=false, -Dlog4j2.disable.jmx=true, -Dlog4j.skipJansi=true, -XX:+HeapDumpOnOutOfMemoryError, -Des.path.home=/usr/share/elasticsearch]
[2018-09-19T19:08:59,377][INFO ][o.e.p.PluginsService     ] [feSXsTX] loaded module [aggs-matrix-stats]
[2018-09-19T19:08:59,378][INFO ][o.e.p.PluginsService     ] [feSXsTX] loaded module [ingest-common]
[2018-09-19T19:08:59,379][INFO ][o.e.p.PluginsService     ] [feSXsTX] loaded module [lang-expression]
[2018-09-19T19:08:59,380][INFO ][o.e.p.PluginsService     ] [feSXsTX] loaded module [lang-groovy]
[2018-09-19T19:08:59,381][INFO ][o.e.p.PluginsService     ] [feSXsTX] loaded module [lang-mustache]
[2018-09-19T19:08:59,382][INFO ][o.e.p.PluginsService     ] [feSXsTX] loaded module [lang-painless]
[2018-09-19T19:08:59,383][INFO ][o.e.p.PluginsService     ] [feSXsTX] loaded module [parent-join]
[2018-09-19T19:08:59,384][INFO ][o.e.p.PluginsService     ] [feSXsTX] loaded module [percolator]
[2018-09-19T19:08:59,384][INFO ][o.e.p.PluginsService     ] [feSXsTX] loaded module [reindex]
[2018-09-19T19:08:59,385][INFO ][o.e.p.PluginsService     ] [feSXsTX] loaded module [transport-netty3]
[2018-09-19T19:08:59,386][INFO ][o.e.p.PluginsService     ] [feSXsTX] loaded module [transport-netty4]
[2018-09-19T19:08:59,389][INFO ][o.e.p.PluginsService     ] [feSXsTX] no plugins loaded
[2018-09-19T19:09:10,792][INFO ][o.e.d.DiscoveryModule    ] [feSXsTX] using discovery type [zen]
[2018-09-19T19:09:14,675][INFO ][o.e.n.Node               ] initialized
[2018-09-19T19:09:14,677][INFO ][o.e.n.Node               ] [feSXsTX] starting ...
[2018-09-19T19:09:15,785][INFO ][o.e.t.TransportService   ] [feSXsTX] publish_address {127.0.0.1:9300}, bound_addresses {127.0.0.1:9300}
[2018-09-19T19:09:15,878][WARN ][o.e.b.BootstrapChecks    ] [feSXsTX] initial heap size [104857600] not equal to maximum heap size [314572800]; this can cause resize pauses and prevents mlockall from locking the entire heap
[2018-09-19T19:09:15,879][WARN ][o.e.b.BootstrapChecks    ] [feSXsTX] system call filters failed to install; check the logs and fix your configuration or disable system call filters at your own risk
[2018-09-19T19:09:19,189][INFO ][o.e.c.s.ClusterService   ] [feSXsTX] new_master {feSXsTX}{feSXsTXeQw-AEPi_pWmySw}{GJAcwscZQNacEta1vC5mPA}{127.0.0.1}{127.0.0.1:9300}, reason: zen-disco-elected-as-master ([0] nodes joined)
[2018-09-19T19:09:19,320][INFO ][o.e.h.n.Netty4HttpServerTransport] [feSXsTX] publish_address {127.0.0.1:9200}, bound_addresses {127.0.0.1:9200}
[2018-09-19T19:09:19,321][INFO ][o.e.n.Node               ] [feSXsTX] started
[2018-09-19T19:09:20,504][INFO ][o.e.g.GatewayService     ] [feSXsTX] recovered [1] indices into cluster_state
[2018-09-19T19:09:21,932][INFO ][o.e.c.r.a.AllocationService] [feSXsTX] Cluster health status changed from [RED] to [YELLOW] (reason: [shards started [[.kibana][0]] ...]).
Nous utilisons des cookies pour vous garantir la meilleure expérience sur notre site. Si vous continuez à utiliser ce dernier, nous considérerons que vous acceptez l'utilisation des cookies.Ok