Pour faire suite à l’article : https://www.cyber-neurones.org/2018/10/raspberry-rsyslog-centralisation-des-logs/ .
(Pour l’instant c’est tombé en marche … le Java c’est pas mon truc).
Je vais donc installer ELK : E sur le Raspberry n°4 / L sur le Raspberry n°3 / K sur le Raspberry n°5. A noter que j’avais essayé de tout mettre sur le même : https://www.cyber-neurones.org/2018/09/osmc-raspberry-ajout-de-elk-elasticsearch-logstash-kibana-beats-nginx/ . Mais régulièrement il fallait relancer à cause de la consommation mémoire ….
| RASP3 |
a020d3 |
ARMv7 Processor rev 4 (v7l) |
949452 |
4.14.50-v7+ |
192.168.0.71 |
Rsyslog Server / Logstash |
OK |
| RASP4 |
a020d3 |
ARMv7 Processor rev 4 (v7l) |
949452 |
4.14.50-v7+ |
192.168.0.72 |
Elasticsearch |
OK |
| RASP5 |
a020d3 |
ARMv7 Processor rev 4 (v7l) |
949452 |
4.14.50-v7+ |
192.168.0.73 |
Kibana |
OK |
Sur le RASP n°4 : Installation de Elasticsearch :
Les commandes :
$ sudo apt-get install default-jre
$ sudo apt-get install openjdk-8-jdk
$ sudo apt-get install oracle-java8-jdk
$ sudo apt-get install -y wget apt-transport-https
$ sudo wget https://artifacts.elastic.co/downloads/elasticsearch/elasticsearch-5.5.2.deb
$ sudo dpkg -i elasticsearch-5.5.2.deb
$ sudo mkdir /var/lib/elasticsearch/tmp
$ sudo chown elasticsearch.elasticsearch /var/lib/elasticsearch/tmp
$ sudo mkdir /usr/share/elasticsearch/tmp
$ sudo chown elasticsearch.elasticsearch /usr/share/elasticsearch/tmp
$ sudo apt-get install libjna-java
$ sudo find / -name libjnidispatch.so
-> Vide !
$ mkdir /tmp/jna-4.1.0
$ cd /tmp/jna-4.1.0
$ wget https://maven.java.net/content/repositories/releases/net/java/dev/jna/jna/4.1.0/jna-4.1.0.jar
$ wget https://maven.java.net/content/repositories/releases/net/java/dev/jna/jna-platform/4.1.0/jna-platform-4.1.0.jar
$ jar xf jna-4.1.0.jar
$ sudo cp jna-4.1.0.jar  jna-platform-4.1.0.jar /usr/share/java/.
$ sudo cp jna-4.1.0.jar jna.jar /usr/share/elasticsearch/lib/.
$ sudo mkdir /usr/lib/jni
$ cd /usr/lib/jni
$ sudo cp -p /tmp/jna-4.1.0/com/sun/jna/linux-arm/libjnidispatch.so libjnidispatch_4.1.0.so
$ sudo ln -s libjnidispatch_4.1.0.so /usr/lib/arm-linux-gnueabihf/libjnidispatch.so
$ sudo ln -s libjnidispatch_4.1.0.so libjnidispatch.so
$ sudo ln -s /usr/lib/arm-linux-gnueabihf/jni/libjnidispatch.system.so /usr/lib/arm-linux-gnueabihf/jni/libjnidispatch.so
$ sudo cp jna-4.1.0.jar  jna-platform-4.1.0.jar /usr/share/java/.
$ sudo mv /usr/share/java/jna-4.2.2.jar /usr/share/java/jna-4.2.2.jar.orig
Attention si on n’installe pas la libjna-java on a l’erreur suivante :
[o.e.b.Natives            ] unable to load JNA native support library, native methods will be disabled.
...
java.lang.UnsatisfiedLinkError: Native library (com/sun/jna/linux-arm/libjnidispatch.so) not found in resource path ....
Pour faire un test il suffit due faire :
$ cd /usr/share/java/
$ java -jar jna-4.2.2.jar
Exception in thread "main" java.lang.UnsatisfiedLinkError: Native library (com/sun/jna/linux-arm/libjnidispatch.so) not found in resource path ([file:/usr/share/java/jna-4.2.2.jar])
	at com.sun.jna.Native.loadNativeDispatchLibraryFromClasspath(Native.java:893)
	at com.sun.jna.Native.loadNativeDispatchLibrary(Native.java:853)
	at com.sun.jna.Native.(Native.java:140)
Alors qu’il faut:
$ cd /usr/share/java/
$ java -jar jna-4.1.0.jar
Java Native Access (JNA) API Version 4
Version: 4.1.0 (b4)
 Native: 4.0.0 (1a6047467b59e8748f975e03016ce3d9)
 Prefix: linux-arm
Modification du fichier de configuration : /etc/elasticsearch/elasticsearch.yml
...
# Set the bind address to a specific IP (IPv4 or IPv6):
#
#network.host: 192.168.0.72
#
# Set a custom port for HTTP:
#
http.port: 9200
...
Le premier lancement nous rappelle qu’il faut de la mémoire, misère :
$ sudo service elasticsearch status
● elasticsearch.service - Elasticsearch
   Loaded: loaded (/usr/lib/systemd/system/elasticsearch.service; disabled; vendor preset: enabled)
   Active: failed (Result: exit-code) since Fri 2018-10-05 21:56:12 UTC; 18s ago
     Docs: http://www.elastic.co
  Process: 19316 ExecStart=/usr/share/elasticsearch/bin/elasticsearch -p ${PID_DIR}/elasticsearch.pid --quiet -Edefault.path.logs=${LOG_DIR} -Edefault.path.data=${DA
  Process: 19313 ExecStartPre=/usr/share/elasticsearch/bin/elasticsearch-systemd-pre-exec (code=exited, status=0/SUCCESS)
 Main PID: 19316 (code=exited, status=1/FAILURE)

Oct 05 21:56:12 raspberrypi systemd[1]: Starting Elasticsearch...
Oct 05 21:56:12 raspberrypi systemd[1]: Started Elasticsearch.
Oct 05 21:56:12 raspberrypi elasticsearch[19316]: Error occurred during initialization of VM
Oct 05 21:56:12 raspberrypi elasticsearch[19316]: Could not reserve enough space for 2097152KB object heap
Oct 05 21:56:12 raspberrypi systemd[1]: elasticsearch.service: Main process exited, code=exited, status=1/FAILURE
Oct 05 21:56:12 raspberrypi systemd[1]: elasticsearch.service: Unit entered failed state.
Oct 05 21:56:12 raspberrypi systemd[1]: elasticsearch.service: Failed with result 'exit-code'.
Modification du fichier : /etc/elasticsearch/jvm.options
...
# Xms represents the initial size of total heap space
# Xmx represents the maximum size of total heap space

-Xms500m
-Xmx800m
...
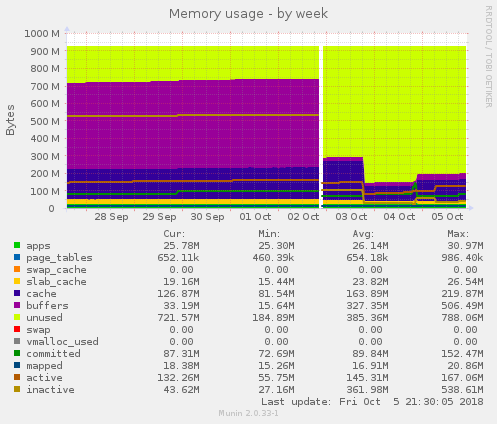
Pour information voici la mémoire avant la mise en place 200 Mo utilisé sur 1000 Mo:
Et on relance :
$ sudo service elasticsearch start
$ sudo service elasticsearch status
● elasticsearch.service - Elasticsearch
   Loaded: loaded (/usr/lib/systemd/system/elasticsearch.service; disabled; vendor preset: enabled)
   Active: active (running) since Fri 2018-10-05 21:59:00 UTC; 3s ago
     Docs: http://www.elastic.co
  Process: 19472 ExecStartPre=/usr/share/elasticsearch/bin/elasticsearch-systemd-pre-exec (code=exited, status=0/SUCCESS)
 Main PID: 19475 (java)
   CGroup: /system.slice/elasticsearch.service
           └─19475 /usr/bin/java -Xms500m -Xmx800m -XX:+UseConcMarkSweepGC -XX:CMSInitiatingOccupancyFraction=75 -XX:+UseCMSInitiatingOccupancyOnly -XX:+AlwaysPreTou

Oct 05 21:59:00 raspberrypi systemd[1]: Starting Elasticsearch...
Oct 05 21:59:00 raspberrypi systemd[1]: Started Elasticsearch.
Sur le RASP n°3 : Installation de Logstach :
Les commandes :
$ sudo apt-get install oracle-java8-jdk
$ sudo apt-get install -y wget apt-transport-https
$ sudo wget https://artifacts.elastic.co/downloads/logstash/logstash-5.5.2.deb
$ sudo dpkg -i logstash-5.5.2.deb
$ sudo service logstash status
● logstash.service - logstash
   Loaded: loaded (/etc/systemd/system/logstash.service; disabled; vendor preset: enabled)
   Active: active (running) since Sat 2018-10-06 10:23:58 UTC; 4s ago
 Main PID: 25708 (java)
   CGroup: /system.slice/logstash.service
           └─25708 /usr/bin/java -XX:+UseParNewGC -XX:+UseConcMarkSweepGC -XX:CMSInitiatingOccupancyFraction=75 -XX:+UseCMSInitiatingOccup

Oct 06 10:23:58 raspberrypi systemd[1]: Started logstash.
On ajoute deux fichiers de configuration :
$ cat /etc/logstash/conf.d/10-syslog.conf
filter {
if [type] == "syslog" {
grok {
match => { "message" => "%{SYSLOGTIMESTAMP:syslog_timestamp} %{SYSLOGHOST:syslog_hostname} %{DATA:syslog_program}(?:[%{POSINT:syslog_pid}])?: %{GREEDYDATA:syslog_message}" }
add_field => [ "received_at", "%{@timestamp}" ]
add_field => [ "received_from", "%{host}" ]
}
syslog_pri { }
date {
match => [ "syslog_timestamp", "MMM d HH:mm:ss", "MMM dd HH:mm:ss" ]
}
}
}

$ cat /etc/logstash/conf.d/30-elasticsearch-output.conf
output {
elasticsearch {
hosts => ["192.168.0.72:9200"]
sniffing => true
manage_template => false
index => "%{[@metadata][beat]}-%{+YYYY.MM.dd}"
document_type => "%{[@metadata][type]}"
}
}
$ sudo service logstash restart
Sur le RASP n°5 : Installation de Kibana :
Les commandes :
$ sudo apt-get install oracle-java8-jdk
$ sudo apt-get install -y wget apt-transport-https
$ sudo wget https://artifacts.elastic.co/downloads/kibana/kibana-5.5.2-linux-x86.tar.gz
$ sudo tar xvzf kibana-5.5.2-linux-x86.tar.gz
$ sudo mv kibana-5.5.2-linux-x86 /opt/.
$ sudo wget https://nodejs.org/download/release/v6.10.2/node-v6.10.2-linux-armv6l.tar.gz
$ tar xzf node-v6.10.2-linux-armv6l.tar.gz
$ sudo cp node-v6.10.2-linux-armv6l/bin/node /usr/local/bin/node
$ sudo cp node-v6.10.2-linux-armv6l/bin/npm /usr/local/bin/npm
$ sudo mv /opt/kibana-5.5.2-linux-x86/node/bin/node  /opt/kibana-5.5.2-linux-x86/node/bin/node.orig
$ sudo mv /opt/kibana-5.5.2-linux-x86/node/bin/npm  /opt/kibana-5.5.2-linux-x86/node/bin/npm.orig
$ sudo ln -s /usr/local/bin/node /opt/kibana-5.5.2-linux-x86/node/bin/node
$ sudo ln -s /usr/local/bin/npm /opt/kibana-5.5.2-linux-x86/node/bin/npm
Modification du fichier : /opt/kibana-5.5.2-linux-x86/config/kibana.yml :
$ cat /opt/kibana-5.5.2-linux-x86/config/kibana.yml | grep -v '^#' | grep -v '^$'
server.port: 5601
server.host: "localhost"
elasticsearch.url: "http://192.168.0.72:9200"
Création du fichier : /etc/systemd/system/kibana.service
$ cat /etc/systemd/system/kibana.service
[Unit]
Description=Kibana

[Service]
ExecStart=/opt/kibana-5.5.2-linux-x86/bin/kibana
StandardOutput=null

[Install]
WantedBy=multi-user.target
Lancement :
$ sudo service kibana start
$ sudo service kibana status
● kibana.service - Kibana
   Loaded: loaded (/etc/systemd/system/kibana.service; disabled; vendor preset: enabled)
   Active: active (running) since Sat 2018-10-06 13:23:13 UTC; 4s ago
 Main PID: 26297 (node)
   CGroup: /system.slice/kibana.service
           └─26297 /opt/kibana-5.5.2-linux-x86/bin/../node/bin/node --no-warnings /opt/kibana-5.5.2-linux-x86/bin/../src/cli

Oct 06 13:23:13 raspberrypi systemd[1]: Started Kibana.
Installation de Ngnix:
$ sudo apt-get install nginx
Note sur l’erreur, quand on a ce type d’erreur il faut faire un apt-get update :
$ sudo apt-get install apache2-utils
Reading package lists... Done
Building dependency tree
Reading state information... Done
The following additional packages will be installed:
  libapr1 libaprutil1
The following NEW packages will be installed:
  apache2-utils libapr1 libaprutil1
0 upgraded, 3 newly installed, 0 to remove and 0 not upgraded.
Need to get 218 kB/374 kB of archives.
After this operation, 814 kB of additional disk space will be used.
Do you want to continue? [Y/n] Y
Err:1 http://raspbian.raspberrypi.org/raspbian stretch/main armhf apache2-utils armhf 2.4.25-3+deb9u4
  404  Not Found [IP: 93.93.128.193 80]
E: Failed to fetch http://raspbian.raspberrypi.org/raspbian/pool/main/a/apache2/apache2-utils_2.4.25-3+deb9u4_armhf.deb  404  Not Found [IP: 93.93.128.193 80]
E: Unable to fetch some archives, maybe run apt-get update or try with --fix-missing?
$ sudo apt update

$ sudo apt-get install apache2-utils
Reading package lists... Done
Building dependency tree
Reading state information... Done
The following additional packages will be installed:
  libapr1 libaprutil1
The following NEW packages will be installed:
  apache2-utils libapr1 libaprutil1
0 upgraded, 3 newly installed, 0 to remove and 48 not upgraded.
Need to get 219 kB/374 kB of archives.
After this operation, 814 kB of additional disk space will be used.
Do you want to continue? [Y/n] Y
Get:1 http://ftp.igh.cnrs.fr/pub/os/linux/raspbian/raspbian stretch/main armhf apache2-utils armhf 2.4.25-3+deb9u5 [219 kB]
Fetched 219 kB in 1s (204 kB/s)
Selecting previously unselected package libapr1:armhf.
(Reading database ... 36061 files and directories currently installed.)
Preparing to unpack .../libapr1_1.5.2-5_armhf.deb ...
Unpacking libapr1:armhf (1.5.2-5) ...
Selecting previously unselected package libaprutil1:armhf.
Preparing to unpack .../libaprutil1_1.5.4-3_armhf.deb ...
Unpacking libaprutil1:armhf (1.5.4-3) ...
Selecting previously unselected package apache2-utils.
Preparing to unpack .../apache2-utils_2.4.25-3+deb9u5_armhf.deb ...
Unpacking apache2-utils (2.4.25-3+deb9u5) ...
Setting up libapr1:armhf (1.5.2-5) ...
Processing triggers for libc-bin (2.24-11+deb9u3) ...
Setting up libaprutil1:armhf (1.5.4-3) ...
Processing triggers for man-db (2.7.6.1-2) ...
Setting up apache2-utils (2.4.25-3+deb9u5) ...
Processing triggers for libc-bin (2.24-11+deb9u3) ...
Modification de /etc/nginx/sites-available/default :
server {
        listen 80 default_server;
        listen [::]:80 default_server;

server_name _;

auth_basic "Restricted Access";
auth_basic_user_file /etc/nginx/htpasswd.users;

location / {
proxy_pass http://localhost:5601;
proxy_http_version 1.1;
proxy_set_header Upgrade $http_upgrade;
proxy_set_header Connection 'upgrade';
proxy_set_header Host $host;
proxy_cache_bypass $http_upgrade;
}
}
Ajout d’un mot de passe :
$ sudo htpasswd -c /etc/nginx/htpasswd.users kibana_admin
Et lancement :
$ sudo systemctl enable nginx.service
Synchronizing state of nginx.service with SysV service script with /lib/systemd/systemd-sysv-install.
Executing: /lib/systemd/systemd-sysv-install enable nginx
$ sudo service nginx status
Sur tous les RAPS je modifie les noms, et j’active les services au démarrage :
Modification de /etc/hosts :
192.168.0.71    RASP3
192.168.0.72    RASP4
192.168.0.73    RASP5
RASP4 :
$ sudo systemctl enable elasticsearch.service
Synchronizing state of elasticsearch.service with SysV service script with /lib/systemd/systemd-sysv-install.
Executing: /lib/systemd/systemd-sysv-install enable elasticsearch
Created symlink /etc/systemd/system/multi-user.target.wants/elasticsearch.service → /usr/lib/systemd/system/elasticsearch.service.
$ cat /etc/hostname
RASP4
$ sudo reboot
RASP3 :
$ sudo systemctl enable logstash.service
Created symlink /etc/systemd/system/multi-user.target.wants/logstash.service → /etc/systemd/system/logstash.service.
$ cat /etc/hostname
RASP3
$ sudo reboot
RASP5 :
$ sudo systemctl enable kibana.service
Created symlink /etc/systemd/system/multi-user.target.wants/kibana.service → /etc/systemd/system/kibana.service.
$ cat /etc/hostname
RASP5
$ sudo reboot
En résumé :
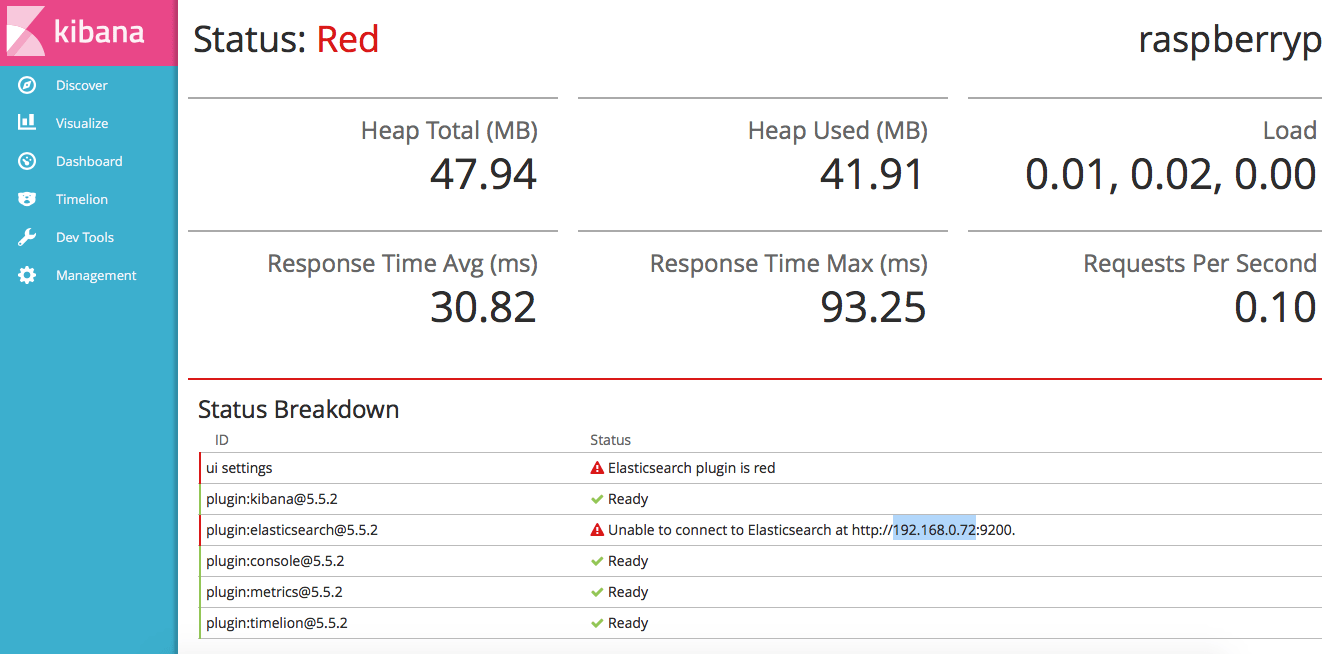
Pour l’instant c’est un échec à cause de elasticsearch :
[o.e.b.JNANatives         ] unable to install syscall filter:
java.lang.UnsupportedOperationException: seccomp unavailable: 'arm' architecture unsupported
J’ai donc essayé de mettre une version plus récente : ( voir ici pour la dernière version : https://www.elastic.co/fr/downloads/elasticsearch )
$ sudo wget https://artifacts.elastic.co/downloads/elasticsearch/elasticsearch-6.4.2.deb
$ sudo dpkg -i  elasticsearch-6.4.2.deb
Mais j’ai toujours l’erreur, avec un plantage :
$ sudo journalctl -u elasticsearch -f
-- Logs begin at Sat 2018-10-06 13:03:13 UTC. --
Oct 06 19:13:14 RASP4 elasticsearch[949]: 2018-10-06 19:13:13,991 main ERROR Null object returned for RollingFile in Appenders.
Oct 06 19:13:14 RASP4 elasticsearch[949]: 2018-10-06 19:13:13,992 main ERROR Null object returned for RollingFile in Appenders.
Oct 06 19:13:14 RASP4 elasticsearch[949]: 2018-10-06 19:13:13,994 main ERROR Unable to locate appender "rolling" for logger config "root"
Oct 06 19:13:14 RASP4 elasticsearch[949]: 2018-10-06 19:13:13,995 main ERROR Unable to locate appender "index_indexing_slowlog_rolling" for logger config "index.indexing.slowlog.index"
Oct 06 19:13:14 RASP4 elasticsearch[949]: 2018-10-06 19:13:13,997 main ERROR Unable to locate appender "audit_rolling" for logger config "org.elasticsearch.xpack.security.audit.logfile.LoggingAuditTrail"
Oct 06 19:13:14 RASP4 elasticsearch[949]: 2018-10-06 19:13:13,998 main ERROR Unable to locate appender "index_search_slowlog_rolling" for logger config "index.search.slowlog"
Oct 06 19:13:14 RASP4 elasticsearch[949]: 2018-10-06 19:13:13,999 main ERROR Unable to locate appender "deprecation_rolling" for logger config "org.elasticsearch.deprecation"
Oct 06 19:13:14 RASP4 systemd[1]: elasticsearch.service: Main process exited, code=exited, status=1/FAILURE
Oct 06 19:13:14 RASP4 systemd[1]: elasticsearch.service: Unit entered failed state.
Oct 06 19:13:14 RASP4 systemd[1]: elasticsearch.service: Failed with result 'exit-code'.
Je pense que le JNA par défaut n’est pas bon :
$ ls -l /usr/share/elasticsearch/lib/jna*
-rw-r--r-- 1 root root 914597 Oct  6 18:54 /usr/share/elasticsearch/lib/jna-4.1.0.jar
-rw-r--r-- 1 root root 885297 Sep 26 13:39 /usr/share/elasticsearch/lib/jna-4.5.1.jar
$ java -jar /usr/share/elasticsearch/lib/jna-4.1.0.jar
Java Native Access (JNA) API Version 4
Version: 4.1.0 (b4)
 Native: 4.0.0 (1a6047467b59e8748f975e03016ce3d9)
 Prefix: linux-arm
$ java -jar  /usr/share/elasticsearch/lib/jna-4.5.1.jar
Exception in thread "main" java.lang.UnsatisfiedLinkError: Native library (com/sun/jna/linux-armel/libjnidispatch.so) not found in resource path ([file:/usr/share/elasticsearch/lib/jna-4.5.1.jar])
	at com.sun.jna.Native.loadNativeDispatchLibraryFromClasspath(Native.java:962)
	at com.sun.jna.Native.loadNativeDispatchLibrary(Native.java:922)
	at com.sun.jna.Native.(Native.java:190)
$ sudo rm /usr/share/elasticsearch/lib/jna-4.5.1.jar
Je pense que l’erreur « ERROR Null object returned for RollingFile in Appenders » est un problème de droit :
$ sudo chown -R elasticsearch.elasticsearch /usr/share/elasticsearch/
A noter que mon fichier de logs est vide alors que tout est en mode debug :
$ sudo grep level /etc/elasticsearch/log4j2.properties
logger.action.level = debug
rootLogger.level = debug
logger.deprecation.level = debug
logger.index_search_slowlog_rolling.level = debug
logger.index_indexing_slowlog.level = debug
logger.xpack_security_audit_logfile.level = debug
logger.xmlsig.level = debug
logger.samlxml_decrypt.level = debug
logger.saml2_decrypt.level = debug
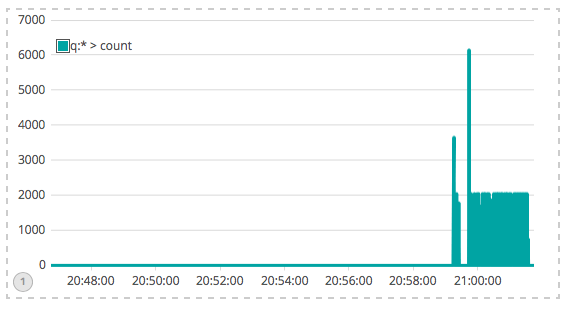
Le reste fonctionne correctement :

Update : Nouvelle tentative de correction :
$ sudo mkdir /home/elasticsearch
$ chown elasticsearch.elasticsearch /home/elasticsearch
$ sudo apt-get install locate
Je viens de voir que le fichier de logs était /usr/share/elasticsearch/logs/elasticsearch.log , alors qu’avant c’était /var/log/elasticsearch/elasticsearch.log.
L’erreur est donc :
X-Pack is not supported and Machine Learning is not available for [linux-arm]; you can use the other X-Pack features (unsupported) by setting xpack.ml.enabled: false in elasticsearch.yml
j’ai donc fait une modification dans le fichier de configuration /etc/elasticsearch/elasticsearch.yml :
network.host: 0.0.0.0
http.port: 9200
xpack.security.enabled: false
xpack.ml.enabled: false
Une erreur aussi avec :
transport.tcp.port: 9300
transport.host: 192.168.0.72
L’erreur est:
bound or publishing to a non-loopback address, enforcing bootstrap checks
Finalement cela a fonctionné avec le fichier suivant :
transport.host: localhost
transport.tcp.port: 9300
http.port: 9200
network.host: 0.0.0.0
xpack.security.enabled: false
xpack.ml.enabled: false
Mais maintenant il me faut faire une mise à jours de Kabana : « This version of Kibana requires Elasticsearch v5.5.2 on all nodes ».
$ sudo wget https://artifacts.elastic.co/downloads/kibana/kibana-6.4.2-linux-x86_64.tar.gz
$ tar zxvf kibana-6.4.2-linux-x86_64.tar.gz
$ sudo mv kibana-6.4.2-linux-x86_64/ /opt/.
$ sudo mv /opt/kibana-6.4.2-linux-x86_64/node/bin/npm /opt/kibana-6.4.2-linux-x86_64/node/bin/npm.org
$ sudo mv /opt/kibana-6.4.2-linux-x86_64/node/bin/node /opt/kibana-6.4.2-linux-x86_64/node/bin/node.org
$ sudo ln -s /usr/local/bin/node /opt/kibana-6.4.2-linux-x86_64/node/bin/node
$ sudo ln -s /usr/local/bin/npm /opt/kibana-6.4.2-linux-x86_64/node/bin/npm
$ /opt/kibana-6.4.2-linux-x86_64/bin/kibana
Kibana does not support the current Node.js version v6.10.2. Please use Node.js v8.11.4.
$ sudo wget https://nodejs.org/download/release/v8.11.4/node-v8.11.4-linux-armv6l.tar.gz
$ tar zxvf node-v8.11.4-linux-armv6l.tar.gz
$ sudo cp node-v8.11.4-linux-armv6l/bin/node /usr/local/bin/node
$ sudo cp node-v8.11.4-linux-armv6l/bin/npm /usr/local/bin/npm
$ sudo cp node-v8.11.4-linux-armv6l/bin/npx /usr/local/bin/.
$ cp  /opt/kibana-5.5.2-linux-x86/config/kibana.yml /opt/kibana-6.4.2-linux-x86_64/config/kibana.yml
Modification du binaire :
$ sudo cat /etc/systemd/system/multi-user.target.wants/kibana.service
[Unit]
Description=Kibana

[Service]
#ExecStart=/opt/kibana-5.5.2-linux-x86/bin/kibana
ExecStart=/opt/kibana-6.4.2-linux-x86_64/bin/kibana
StandardOutput=null

[Install]
WantedBy=multi-user.target
$ sudo systemctl status kibana.service
● kibana.service - Kibana
   Loaded: loaded (/etc/systemd/system/kibana.service; enabled; vendor preset: enabled)
   Active: active (running) since Sat 2018-10-06 21:11:09 UTC; 1min 21s ago
 Main PID: 19648 (node)
   CGroup: /system.slice/kibana.service
           └─19648 /opt/kibana-5.5.2-linux-x86/bin/../node/bin/node --no-warnings /opt/kibana-5.5.2-linux-x86/bin/../src/cli

Oct 06 21:11:09 RASP5 systemd[1]: Started Kibana.
Maintenant il me faut finaliser Elasticsearch :
$ sudo /usr/share/elasticsearch/bin/elasticsearch-plugin install ingest-geoip
Et aussi faire une mise à jours sur logstash :
$ sudo wget https://artifacts.elastic.co/downloads/logstash/logstash-6.4.2.deb
$  sudo dpkg -i logstash-6.4.2.deb
...
Java HotSpot(TM) Client VM warning: INFO: os::commit_memory(0x37800000, 1006632960, 0) failed; error='Cannot allocate memory' (errno=12)
/usr/share/logstash/bin/system-install: line 88: #: command not found

$ sudo ln -s /etc/logstash/ /usr/share/logstash/config
Mauvaise idée ..
Misère.
Update : Je viens de regarder les logs du Logstach et c’est la misère.
$ grep "ERROR" /var/log/logstash/logstash-plain.log | grep  "java.lang.IllegalStateException: Logstash stopped processing because of an error" | wc -l
285
L’erreur complète est la suivante :
[ERROR][org.logstash.Logstash    ] java.lang.IllegalStateException: Logstash stopped processing because of an error: (LoadError) Could not load FFI Provider: (NotImplementedError) FFI not available: java.lang.UnsatisfiedLinkError: /tmp/jffi1286084619674356675.so: /tmp/jffi1286084619674356675.so: cannot open shared object file: No such file or directory
...
See http://jira.codehaus.org/browse/JRUBY-4583
J’essaye de faire une modification sur /etc/logstash/jvm.options :
$ cat /etc/logstash/jvm.options | grep -v "^$" | grep -v "^#"
-Xms200m
-Xmx500m
-Djruby.native.verbose=true
-Djava.io.tmpdir=/tmp/
-XX:+UseParNewGC
-XX:+UseConcMarkSweepGC
-XX:CMSInitiatingOccupancyFraction=75
-XX:+UseCMSInitiatingOccupancyOnly
-Djava.awt.headless=true
-Dfile.encoding=UTF-8
-Djruby.compile.invokedynamic=true
-Djruby.jit.threshold=0
-XX:+HeapDumpOnOutOfMemoryError
-Djava.security.egd=file:/dev/urandom
J’aime ça :
J’aime chargement…